Press Releases

SCOTTSDALE, Ariz., Aug. 7, 2018 /PRNewswire/ -- Axon (Nasdaq: AAXN), the global leader in public safety technology, today released the following quarterly update letter to shareholders. Results included:
- Total quarterly revenue of $99 million, up 25% year-over-year
- Axon Cloud revenue of $23 million, up 76% year-over-year
- Software & Sensors annual recurring revenue of $92.7 million, up 70% year-over-year
- Completed a successful $246 million public offering of common stock
- Began field testing of Axon Records with a partner agency
- Maintaining full year revenue guidance; reiterating full year operating margin outlook and introducing full year adjusted EBITDA margin guidance of 14% to 16%
Dear shareholders,
We made significant progress this past quarter in building out the Axon network. We added key capabilities through new partnerships with DJI and Milestone Systems, bringing drone and CCTV compatibility to our network. We also announced Axon Fleet 2, our second generation in-car video system, which builds upon the momentum of Axon Fleet. By Q4 of last year, Axon Fleet became the number one in-car video system in the U.S. by order volume according to our win-loss analysis, and we continue to vie for the top spot each quarter. Axon Fleet demonstrates the power of the Axon network to drive success in new segments where the network effects of seamless integration create highly valuable and unique differentiation. We hope to see similar results with Axon Records, our next major initiative, which has begun field testing with a partner agency. We have also staffed a team and begun development of Axon Dispatch, the next major cloud software system that will follow Records. Finally, we expanded our user base with the acquisition of VIEVU, and ended the quarter with over 300,000 booked seats.
Our product pipeline is key to delivering upon our long-term growth objectives. We continue to scale our research and development organization, with significant progress building out our engineering team year-to-date. We discuss more product development milestones, and what our teams are working on, below.
The market appears to be validating our approach. In July, Honolulu became the 45th major city to join the Axon network with the order of 1,200 body cameras and unlimited storage on Evidence.com. And our international customer momentum continues. In July, Alberta's Calgary Police Service became the first major city in Canada to join the Axon network, and in June, the Cumbria Constabulary became the first UK law enforcement agency to roll out Axon Citizen, our public evidence submission tool.
In June, we hosted our annual Axon Accelerate user conference in Scottsdale. In three years, we've built the largest technology conference in policing, which immerses chiefs, public information officers, prosecutors, officers and media in the Axon network for 48 hours. More than 1,100 law enforcement personnel attended the conference, representing significant growth compared with 400 attendees last year. We also attracted several large sponsors, including Microsoft. More importantly, so far we've seen Axon Accelerate customer leads become nearly as large as those that we generate at The International Association of Chiefs of Police annual conference. As we continue to build Axon Accelerate, we expect it to become the preeminent tech conference in public safety.
Planning also continues for our next generation manufacturing facility in Scottsdale, which would consolidate four office locations into one building and bring more automation to future generations of product hardware. Production of our current hardware product suite is highly manual — less than 50% of part manufacturing is automated. We have plans to automate more than 75% of future hardware production.
Finally, in the second quarter we completed a successful follow-on offering of common shares, raising gross proceeds of $246 million. The offering strengthened Axon's financial position, providing us with enhanced flexibility as we transition more of our product sales to subscription pricing models, while also enabling us to continue investing for growth.
For those shareholders new to Axon, we are investing in four strategic growth areas, which we believe represent the future of critical public safety technology:
- TASER less-lethal weapons,
- Sensors hardware including on-officer body cameras and Axon Fleet in-car video systems,
- The Evidence.com connected SAAS network, and
- Axon Records and Computer Aided Dispatch software.
These value streams exist within an estimated $7.7 billion total addressable market, comprising TASER weapons ($1.5 billion), hardware sensors ($0.7 billion), and cloud-based public safety software ($5.5 billion.)
We are focused on building highly defensible subscription revenue models that are expected to provide stable and consistent recurring revenue, and developing software that generates network effects that will add to the stability of our recurring revenue streams.
Summary of Q2 2018 Results (1)
- Revenue of $99 million grew 25% year-over-year.
- International revenue grew 52% year-over-year to $20 million, driven by strength in Australia, Canada, France, and the UK.
- Gross margin of 63.6% reflects a strong product mix in weapons and continued Axon Cloud growth, partially offset by low gross margin VIEVU contracts.
- Operating expenses of $57.8 million were up 14% sequentially. Excluding one-time acquisition and integration costs of $1.4 million associated with the purchase of VIEVU, operating expenses were $56.4 million, up 11% sequentially, driven by continued hiring in R&D (up 22% sequentially) and investments in SG&A (up 6% sequentially excluding one-time acquisition and integration costs) as we scale.
- GAAP EPS of $0.15 was favorably impacted by $0.06 of discrete tax benefits related to CEO stock option exercises in the quarter. Non-GAAP EPS of $0.18, which excludes $0.06 of discrete tax benefits, grew 100% year-over-year.
- Adjusted EBITDA of $13.7 million, up 69% year-over-year, and Adjusted EBITDA margin of 13.8%.
|
(1) Amounts for Q2 2017 have not been adjusted under the modified retrospective method of adoption of Topic 606, and are presented consistent with the prior period amounts reported under ASC 605. Revenue for Q2 2018 would have been $98.6 million under ASC 605. |
|
Financial Commentary by Segment |
|||||||||||||||||
|
|
|||||||||||||||||
|
TASER Weapons |
|||||||||||||||||
|
|
Three Months Ended |
|
Change |
||||||||||||||
|
|
June 30, 2018 |
|
March 31, 2018 |
|
June 30, 2017 (1) |
|
QoQ |
|
YoY |
||||||||
|
TASER Weapons |
|
|
|
|
|
|
|
|
|
||||||||
|
Net sales |
$ |
60,624 |
|
|
$ |
63,524 |
|
|
$ |
53,016 |
|
|
(4.6)% |
|
|
14.4 |
% |
|
Gross margin |
70.8 |
% |
|
67.7 |
% |
|
69.7 |
% |
|
310bp |
|
110bp |
|||||
|
|
|
(1) Amounts for the three months ended June 30, 2017 have not been adjusted under the modified retrospective method of adoption of Topic 606, and are presented consistent with the prior period amounts reported under ASC 605. |
- TASER Weapons sales in Q2 reflect typical weapons seasonality.
- Strong gross margins were driven by product mix.
- In the quarter, 30% of TASER orders were on a service plan, compared with 40% in Q1 2018. The sequential decrease reflects seasonality and a mix that included large orders from distributors and international customers.
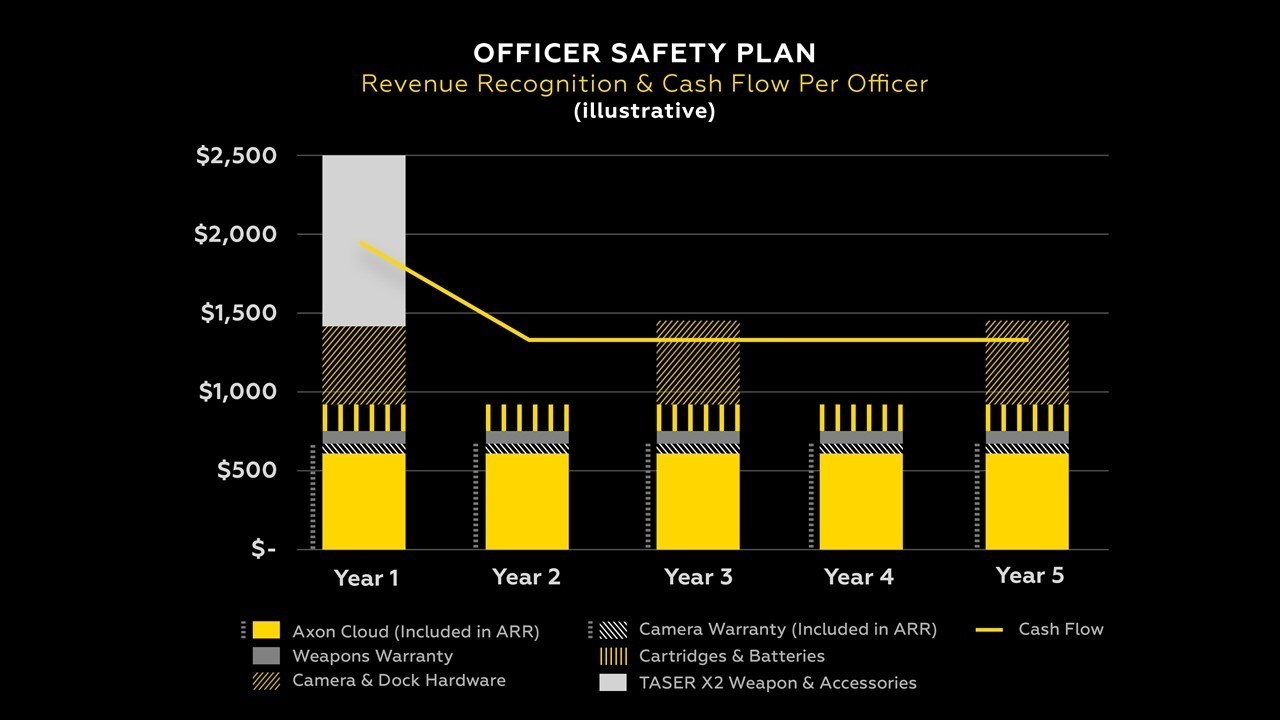
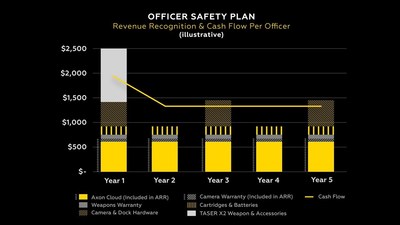
- The following chart illustrates the expected revenue recognition and cash flow per officer on a regularly priced standard Officer Safety Plan, which is our $109 per month plan that includes a TASER weapon, cartridges, an Axon body camera, camera hardware refreshes, and an Evidence.com seat license with data storage.
|
Software & Sensors |
|||||||||||||||||
|
|
|
|
|
||||||||||||||
|
|
Three Months Ended |
|
Change |
||||||||||||||
|
|
June 30, 2018 |
|
March 31, 2018 |
|
June 30, 2017 (1) |
|
QoQ |
|
YoY |
||||||||
|
Software and Sensors |
|
|
|
|
|
|
|
|
|
||||||||
|
Axon Cloud net sales |
$ |
22,505 |
|
|
$ |
20,241 |
|
|
$ |
12,768 |
|
|
11.2 |
% |
|
76.3 |
% |
|
Axon Cloud gross margin |
77.8 |
% |
|
78.7 |
% |
|
70.0 |
% |
|
-90bp |
|
|
780bp |
|
|||
|
|
|
|
|
|
|
|
|
|
|
||||||||
|
Sensors and Other net sales |
$ |
16,097 |
|
|
$ |
17,450 |
|
|
$ |
13,859 |
|
|
(7.8)% |
|
|
16.1 |
% |
|
Sensors and Other gross margin |
16.7 |
% |
|
31.9 |
% |
|
(1.7)% |
|
|
-1,520bp |
|
|
1,840bp |
|
|||
|
|
|
(1) Amounts for the three months ended June 30, 2017 have not been adjusted under the modified retrospective method of adoption of Topic 606, and are presented consistent with the prior period amounts reported under ASC 605. |
- Continued adoption of Axon Cloud, which includes software-as-a-service subscriptions to Evidence.com, drove 76% revenue growth year-over-year.
- Sensors and Other sales, which have historically fluctuated, were driven by record Axon Fleet unit shipments in the second quarter. As expected, Sensors and Other gross margins were unfavorably affected by the integration of VIEVU's contracts as well as hardware mix, including the first generation of Axon Fleet.
- Software & Sensors bookings were $89 million in the quarter.
- Software & Sensors annual recurring revenue (software & warranty) grew to $92.7 million, representing a 70% gain year-over-year and a 11% gain sequentially.
- As of June 30, 2018, Software & Sensors backlog was approximately $650 million, which is a subset of Axon's total remaining performance obligations of approximately $750 million.
- As of June 30, 2018, we had 305,200 booked seats on the Axon network, representing an increase of 78,300 seats from March 31, 2018. We had a mix of organic user growth as well as seats added from the VIEVU acquisition. We also reclassified some camera seats that were originally booked on-premise but were migrated into the cloud.
- We've identified a glide path to winding down operating expenses associated with VIEVU driven by our transitioning of customers onto the Axon network. In the meantime, we continue to incur integration costs largely associated with user migration. We have established competency with large scale and complex data projects, having moved the entire instance of Evidence.com off of the Amazon Web Services cloud and onto the Microsoft Azure cloud in late 2017. The VIEVU user migration is substantially smaller, but has unique components because the data was not captured by our hardware or stored in software that we designed. We expect to continue to incur integration costs throughout the remainder of the year.
Updates on our Product Pipeline:
Axon Fleet - This summer, we launched Axon Fleet 2, which offers substantial hardware improvements over Axon Fleet, including high-definition video with a wide field of view, zoom capability, infrared for the back seat camera, and wireless microphone integration so that no important sounds are lost. We expect the first Axon Fleet 2 units to begin shipping soon.
Evidence.com - We are driving higher average revenue per user for new Evidence.com sign-ups as our cloud-based software continues to add capability. What was once simply a tool for storing and managing body camera video has now expanded to store multiple types of evidence data, including body camera footage, CCTV footage, drone footage, and citizen-submitted photo and video evidence. In Q2, we strategically partnered with Milestone Systems, a world-leading open platform IP video management software provider. The partnership with Milestone brings data from more than 6,000 models of cameras from 150 manufacturers, including CCTV footage, into Evidence.com. Data that is stored in Evidence.com is secure, trackable, easily shareable, and redactable.
Axon is also making it easier than ever for law enforcement agencies to ingest CCTV camera footage. The old method included burning video to a DVD and physically handing the disc to detectives. With our technology, footage can get pushed to Evidence.com via our new integration with Milestone, or collected from just about anywhere via the Axon Citizen mobile upload tool.
Average revenue per user dipped slightly in Q2 on a sequential basis due to the integration of VIEVU's customers and contracts. That said, in Q2 2018, we saw new customer sign ups at higher ARPUs than Q2 2017 and we feel confident in our ability to grow ARPU over the long-term as Evidence.com's value proposition expands with added features.
Axon Records - Axon Records remains in its pre-revenue investment phase, although it is now transitioning into field testing. We are working toward refining a best-in-class officer interface, and ensuring that our reporting function is scalable and customizable. Beyond incident reporting capability, we are also building out crime analysis, records review capability, and investigations and case tracking.
As noted earlier, we are field testing the first iteration of Axon Records with a partner law enforcement agency. The Axon Records pilot ties into the agency's existing records management system, providing a seamless experience for this first partner agency and allowing us to build capability incrementally, and iterate and test quickly. The pilot's capability suite is a subset of the more robust system we are building, which in the future will include body camera transcription and automated report writing assisted by artificial intelligence and machine learning.
Initial feedback from officers using our product has been positive — we are already helping save time writing incident reports. We hope to go live with two more development partners by the end of 2018. These development partners would serve as our initial reference accounts once the product goes to market.
We are aiming for a generally available product in mid-2019 that would fulfill the needs of most US law enforcement agencies, and offer a far superior user experience. We have identified a pipeline of agencies that are interested in becoming customers. Hiring engineering talent remains a key area of focus and execution. Given the amount of customer research and feedback we have undertaken, we feel confident about the specific feature sets we are choosing to develop.
To recap, Axon Records is our technology solution that will reduce the time officers spend writing reports so they can spend more time policing. Modern police record-keeping is fundamentally about gathering the evidence associated with an event and transferring it to a prosecutor to use in the court system. Axon's market-leading body camera data management solution, Evidence.com, is highly valuable because digital video evidence is often critically important to the larger incident record. Axon Records will build out our existing software ecosystem by integrating body camera video with other incident data, streamlining and using the body camera to assist in reporting, and allow records to be securely stored in our cloud, shared and redacted.
Artificial Intelligence (AI) & Machine Learning (ML) - Deploying AI and ML tools to the public safety sector requires areas of investment that are often not required in the civilian or consumer sectors, which is why we are seeing the benefits of specializing on the public safety vertical. In Q2, Axon opened the industry's first center for AI training on public safety data, which we designed in compliance with the FBI's Criminal Justice Information Services (CJIS) Security Policy. Customer agencies must opt-in to share data with our center, which has a heightened level of security. Our AI solutions include developing software to automate redaction, to enable vehicle, speech and critical event recognition, speech transcription, automatic license plate recognition, and automated data analysis. For critical event recognition, we are developing an AI solution to detect officers' actions, such as foot chases, which could help notify other officers that a critical event is unfolding. Axon formed its AI research team in February 2017 after acquiring two AI research and engineering teams, Dextro and Misfit (previously part of Fossil Group, Inc.).
Axon Air - We launched Axon Air in June at our annual user conference, Axon Accelerate. Under an exclusive partnership, within the digital evidence management industry, with DJI, the world's leader in civilian drones and aerial imaging technology, we can sell DJI drones directly to public safety and law enforcement agencies worldwide. More than 900 public safety agencies use drones to support tactical actions, reconstruct traffic collisions, observe large events, and perform search and rescue. Through Axon Air, law enforcement agencies can purchase DJI drone technology directly from Axon, which has strong customer relationships in law enforcement and expertise in agency contracting. Camera footage from the drones can be safely stored and managed in Axon's cloud, Evidence.com. Axon's software and sales teams are also supporting law enforcement agencies in managing their drone programs. We are developing a long-term software roadmap to add drone specific advanced features that will create unique capabilities for our customers.
Outlook:
We are providing the following updated guidance for the full year ending December 31, 2018:
- Maintaining revenue growth guidance of 18%-20%;
- Adjusted EBITDA margins of 14% to 16%, which compares with Adjusted EBITDA margin of 11.6% in 2017;
- This guidance aligns with our previously communicated outlook to achieve 300 to 400 basis points of operating margin expansion in 2018, excluding integration costs related to the VIEVU acquisition and the non-cash stock-based compensation expense associated with CEO Rick Smith's 10-year compensation plan. Going forward, we will be moving from operating margin to Adjusted EBITDA margin guidance, which provides a simpler and more relevant period-over-period comparison;
- A normalized tax rate of 20% to 25%, which can fluctuate depending on geography of income and the effects of discrete items, including changes in our stock price; and
- Capital expenditures in the range of $12 million to $16 million.
We believe we have the right vision for the future of law enforcement, and we are committed to superior execution against our plans.
Signed,
Rick Smith, CEO
Luke Larson, President
Jawad Ahsan, CFO
QUARTERLY CONFERENCE CALL & WEBCAST:
We will host our Q2 2018 earnings conference call on Tuesday, August 7, 2018 at 2 p.m. PT / 5 p.m. ET.
To join the live audio call, please dial 877-303-9126 (domestic) or +1-253-237-1156 (international) and use conference ID number 9995809.
The call will be available via live audio webcast and archived replay on Axon's investor relations website at http://investor.axon.com.
Statistical Definitions
Software & Sensors bookings are an indication of the activity the Company is seeing relative to Software & Sensors hardware, software and Evidence.com. We consider bookings to be a statistical measure defined as the sales price of orders (not invoiced sales), including contractual optional periods we expect to be exercised, net of cancellations, placed in the relevant fiscal period, regardless of when the products or services ultimately will be provided. Most bookings will be invoiced in subsequent periods.
Due to municipal government funding rules, in some cases certain of the future period amounts included in bookings are subject to budget appropriation or other contract cancellation clauses. Although Axon has entered into contracts for the delivery of products and services in the future and anticipates the contracts will be fulfilled, if agencies do not exercise contractual options, do not appropriate money in future year budgets or do enact a cancellation clause, revenue associated with these bookings may not ultimately be recognized, resulting in a future reduction to bookings.
For more information relative to our revenue recognition policies, please reference our SEC filings.
Non-GAAP Measures
To supplement the Company's financial results presented in accordance with GAAP, we present the non-GAAP financial measures of EBITDA, Adjusted EBITDA, Non-GAAP Net Income and Non-GAAP Diluted Earnings Per Share. The Company's management uses these non-GAAP financial measures in evaluating the Company's performance in comparison to prior periods. We believe that both management and investors benefit from referring to these non-GAAP financial measures in assessing its performance, and when planning and forecasting our future periods. A reconciliation of GAAP to the non-GAAP financial measures is presented herein.
- EBITDA (Most comparable GAAP Measure: Net income) - Earnings before interest expense, investment interest income, taxes, depreciation and amortization.
- Adjusted EBITDA (Most comparable GAAP Measure: Net income) - Earnings before interest expense, investment interest income, taxes, depreciation, amortization, non-cash stock-based compensation expense and pre-tax certain other items (described below).
- Non-GAAP Net Income (Most comparable GAAP Measure: Net income) - Net income excluding the costs of non-cash stock-based compensation and excluding pre-tax certain other items, including, but not limited to, net gain/loss/write-down/disposal/abandonment of property, equipment and intangible assets; and loss on impairment. The Company tax-effects non-GAAP adjustments using the blended statutory federal and state tax rates for each period presented.
- Free Cash Flow (Most comparable GAAP Measure: Cash flow from operating activities) - cash flows provided by operating activities minus purchases of property, plant and equipment, intangible assets and cash flows related to business acquisitions.
- Non-GAAP Diluted Earnings Per Share (Most Comparable GAAP Measure: Earnings Per share) - Measure of Company's Non-GAAP Net Income divided by the weighted average number of diluted common shares outstanding during the period presented.
Caution on Use of Non-GAAP Measures
Although these non-GAAP financial measures are not consistent with GAAP, management believes investors will benefit by referring to these non-GAAP financial measures when assessing the Company's operating results, as well as when forecasting and analyzing future periods. However, management recognizes that:
- these non-GAAP financial measures are limited in their usefulness and should be considered only as a supplement to the Company's GAAP financial measures;
- these non-GAAP financial measures should not be considered in isolation from, or as a substitute for, the Company's GAAP financial measures;
- these non-GAAP financial measures should not be considered to be superior to the Company's GAAP financial measures; and
- these non-GAAP financial measures were not prepared in accordance with GAAP and investors should not assume that the non-GAAP financial measures presented in this earnings release were prepared under a comprehensive set of rules or principles.
Further, these non-GAAP financial measures may be unique to the Company, as they may be different from similarly titled non-GAAP financial measures used by other companies. As such, this presentation of non-GAAP financial measures may not enhance the comparability of the Company's results to the results of other companies.
About Axon
Axon is a network of devices, apps, and people that helps law enforcement become smarter and safer. Our mission is to Protect Life. Our technologies give law enforcement and public safety personnel the confidence, focus and time they need to keep their communities safe. Our products impact every aspect of an officer's day-to-day experience:
In the field- Our Smart Weapons offer a less-lethal intermediate use of force response and our body-worn and in-car cameras collect video evidence to capture the truth of an incident; and our mobile applications enable simple evidence collection.
At the station- Our secure, cloud-based digital evidence management solution allows officers and command staff to manage, review, share, and process digital evidence using forensic, redaction, transcription, and other tools.
In the courtroom- Our solutions for prosecutors make collaborating across jurisdictions and agencies easy so that cases can be resolved quickly.
We work hard for those who put themselves in harm's way for all of us. To date, there are more than 305,200 software seats booked on the Axon network around the world and more than 200,000 lives and countless dollars have been saved with the Axon network of devices, apps and people. Learn more at www.axon.com or by calling (800) 978-2737.
Facebook is a trademark of Facebook, Inc. Twitter is a trademark of Twitter, Inc.
Axon, Axon Fleet, Axon Network, Axon Records, Evidence.com, the "Axon Delta" logo, "Protect Life," Smart Weapons, TASER, X2, and X26P are trademarks of Axon Enterprise, Inc., some of which are registered in the US and other countries. For more information, visit www.axon.com/legal. All rights reserved.
Follow Axon here:
Axon on Twitter: https://twitter.com/axon_us
Axon on Facebook: https://www.facebook.com/Axon.ProtectLife/
Forward-looking statements
Certain statements contained in this press release that are not historical are "forward-looking statements" within the meaning of Section 27A of the Securities Act of 1933, as amended (the "Securities Act"), and Section 21E of the Securities Exchange Act of 1934, as amended (the "Exchange Act"), including statements regarding our expectations, beliefs, intentions and strategies regarding the future. We intend that such forward-looking statements be subject to the safe-harbor provided by the Private Securities Litigation Reform Act of 1995. These estimates and statements speak only as of the date on which they are made, are not guarantees of future performance, and involve certain risks, uncertainties and assumptions that are difficult to predict. Axon Enterprise, Inc. assumes no obligation to update the information contained in this press release, except as required by law. We caution that these statements are qualified by important risk factors that could cause actual results to differ materially from those reflected by the forward looking statements herein. These factors can be found in our Form 10-K for the year ended December 31, 2017, under the heading, "Risk Factors."
Such forward-looking statements relate to, among other things: our intentions and beliefs about future development efforts and activities, including our intentions to invest in R&D as well as the development of new product and service lines and enhanced features for our existing product and service lines; intentions to shift an increasing amount of business to a subscription model; our need that customers upgrade and replace existing conducted electrical weapons ("CEW") units and the willingness of customers to do so; that we may have more sales denominated in foreign currencies in 2018; our intention to increase our investment in the development of sales in the international, military and law enforcement market; our plans to expand our sales force; that cloud and mobile technologies are fundamentally changing the police environment; our plan to invest in web activities and law enforcement trade shows in 2018; our intention to not pay dividends; that increases in marketing and sales activities will lead to an increase in sales; our belief that the video evidence capture and management market will grow significantly in the near future and the reasons for that belief; our intention to continue to pursue the personal security market; our intention to grow direct sales; the sufficiency of our facilities and our strategy to expand manufacturing capacity if needed; that we may lease facilities from parties that specialize in handling and manufacturing of firearm materials; that we expect to continue to depend on sales of our X2 and X26P CEW devices; our intention to apply for and prosecute our patents; that selling, general and administrative expense will increase in 2018; that research and development expenses will increase in 2018; the timing of the resolution of uncertain tax positions; our intention to hold investments to maturity; the effect of interest rate changes on our annual interest income; that we may engage in currency hedging activities; our intentions concerning, and the effectiveness of, our ongoing marketing efforts through web activities, trial programs, tech summits and law enforcement trade shows; our belief that customers will honor multi-year contracts despite the existence of appropriations, termination for convenience. or similar clauses; our belief that customers will renew their Evidence.com service subscriptions at the end of the contractual term; estimates regarding the size of our target markets and our competitive position in existing markets; the availability of alternative materials and components suppliers; the benefits of the continued automation of our production process; the sufficiency and availability of our liquid assets and capital resources; our financing and growth strategies, including: potential joint ventures, mergers and acquisitions, stock repurchases and hedging activities; the safety of our products; our litigation strategy, including the outcome of legal proceedings in which we are currently involved; expectations regarding increased operating leverage; the impact of a loss of customer data, a breach of security or an extended outage; the effect of current and future tax strategies; the fluctuations in our effective tax rate; the impact of the U.S. Tax Cuts and Jobs Act (the "Tax Act"); the impact of recently adopted and future accounting standards; the impact of Accounting Standards Update ("ASU") 2014-09, Revenue from Contracts with Customers ("ASU 2014-09") and ASC Subtopic 340-40, Other Assets and Deferred Costs - Contracts with Customers ("ASC 340-40") (collectively, "Topic 606"); and the ultimate resolution of financial statement items requiring critical accounting estimates, including those set forth in our Form 10-K for the year ended December 31, 2017.
Please visit http://investor.axon.com, https://www.axon.com/press, www.twitter.com/axon_us and https://www.facebook.com/Axon.ProtectLife/ where Axon discloses information about the company, its financial information, and its business.
Visit our Investor Relations Safe Harbor Statement at:http://investor.axon.com/safeHarbor.cfm
For investor relations information please contact Andrea James via email at IR@axon.com.
|
AXON ENTERPRISE, INC. CONDENSED CONSOLIDATED STATEMENTS OF OPERATIONS (Unaudited) (in thousands, except per share data) |
|||||||||||||||||||
|
|
|
|
|
||||||||||||||||
|
|
Three Months Ended |
|
Six Months Ended June 30, |
||||||||||||||||
|
|
June 30, 2018 |
|
March 31, 2018 |
|
June 30, 2017 (1) |
|
2018 |
|
2017 (1) |
||||||||||
|
Net sales from products |
$ |
76,721 |
|
|
$ |
80,974 |
|
|
$ |
66,875 |
|
|
$ |
157,695 |
|
|
$ |
134,366 |
|
|
Net sales from services |
22,505 |
|
|
20,241 |
|
|
12,768 |
|
|
42,746 |
|
|
24,519 |
|
|||||
|
Net sales |
99,226 |
|
|
101,215 |
|
|
79,643 |
|
|
200,441 |
|
|
158,885 |
|
|||||
|
Cost of product sales |
31,087 |
|
|
32,434 |
|
|
30,172 |
|
|
63,521 |
|
|
57,244 |
|
|||||
|
Cost of service sales |
4,996 |
|
|
4,320 |
|
|
3,834 |
|
|
9,316 |
|
|
7,334 |
|
|||||
|
Cost of sales |
36,083 |
|
|
36,754 |
|
|
34,006 |
|
|
72,837 |
|
|
64,578 |
|
|||||
|
Gross margin |
63,143 |
|
|
64,461 |
|
|
45,637 |
|
|
127,604 |
|
|
94,307 |
|
|||||
|
Operating expenses: |
|
|
|
|
|
|
|
|
|
||||||||||
|
Sales, general and administrative |
39,343 |
|
|
35,759 |
|
|
31,824 |
|
|
75,102 |
|
|
62,681 |
|
|||||
|
Research and development |
18,501 |
|
|
15,119 |
|
|
12,989 |
|
|
33,620 |
|
|
25,452 |
|
|||||
|
Total operating expenses |
57,844 |
|
|
50,878 |
|
|
44,813 |
|
|
108,722 |
|
|
88,133 |
|
|||||
|
Income from operations |
5,299 |
|
|
13,583 |
|
|
824 |
|
|
18,882 |
|
|
6,174 |
|
|||||
|
Interest and other income (expense), net |
(295) |
|
|
1,263 |
|
|
1,684 |
|
|
968 |
|
|
1,890 |
|
|||||
|
Income before provision for income taxes |
5,004 |
|
|
14,846 |
|
|
2,508 |
|
|
19,850 |
|
|
8,064 |
|
|||||
|
Provision for (benefit from) income taxes |
(3,481) |
|
|
1,920 |
|
|
232 |
|
|
(1,561) |
|
|
1,208 |
|
|||||
|
Net income |
$ |
8,485 |
|
|
$ |
12,926 |
|
|
$ |
2,276 |
|
|
$ |
21,411 |
|
|
$ |
6,856 |
|
|
Net income per common and common equivalent shares: |
|
|
|
|
|
|
|
|
|
||||||||||
|
Basic |
$ |
0.15 |
|
|
$ |
0.24 |
|
|
$ |
0.04 |
|
|
$ |
0.39 |
|
|
$ |
0.13 |
|
|
Diluted |
$ |
0.15 |
|
|
$ |
0.24 |
|
|
$ |
0.04 |
|
|
$ |
0.38 |
|
|
$ |
0.13 |
|
|
Weighted average number of common and common equivalent shares outstanding: |
|
|
|
|
|
|
|
|
|
||||||||||
|
Basic |
55,527 |
|
|
53,119 |
|
|
52,736 |
|
|
54,330 |
|
|
52,578 |
|
|||||
|
Diluted |
57,054 |
|
|
54,532 |
|
|
53,770 |
|
|
55,892 |
|
|
53,723 |
|
|||||
|
|
|
(1) Amounts for the three and six months ended June 30, 2017 have not been adjusted under the modified retrospective method of adoption of Topic 606, and are presented consistent with the prior period amounts reported under ASC 605. |
|
AXON ENTERPRISE, INC. SEGMENT REPORTING (Unaudited) (dollars in thousands) |
|||||||||||||||||||||||||||||||||||
|
|
|||||||||||||||||||||||||||||||||||
|
|
Three Months Ended June 30, 2018 |
|
Three Months Ended March 31, 2018 |
|
Three Months Ended June 30, 2017 (1) |
||||||||||||||||||||||||||||||
|
|
TASER |
|
Software and Sensors |
|
Total |
|
TASER |
|
Software and Sensors |
|
Total |
|
TASER |
|
Software and Sensors |
|
Total |
||||||||||||||||||
|
Net sales from products (2) |
$ |
60,624 |
|
|
$ |
16,097 |
|
|
$ |
76,721 |
|
|
$ |
63,524 |
|
|
$ |
17,450 |
|
|
$ |
80,974 |
|
|
$ |
53,016 |
|
|
$ |
13,859 |
|
|
$ |
66,875 |
|
|
Net sales from services (3) |
— |
|
|
22,505 |
|
|
22,505 |
|
|
— |
|
|
20,241 |
|
|
20,241 |
|
|
— |
|
|
12,768 |
|
|
12,768 |
|
|||||||||
|
Net sales |
60,624 |
|
|
38,602 |
|
|
99,226 |
|
|
63,524 |
|
|
37,691 |
|
|
101,215 |
|
|
53,016 |
|
|
26,627 |
|
|
79,643 |
|
|||||||||
|
Cost of product sales |
17,681 |
|
|
13,406 |
|
|
31,087 |
|
|
20,543 |
|
|
11,891 |
|
|
32,434 |
|
|
16,078 |
|
|
14,094 |
|
|
30,172 |
|
|||||||||
|
Cost of service sales |
— |
|
|
4,996 |
|
|
4,996 |
|
|
— |
|
|
4,320 |
|
|
4,320 |
|
|
— |
|
|
3,834 |
|
|
3,834 |
|
|||||||||
|
Cost of sales |
17,681 |
|
|
18,402 |
|
|
36,083 |
|
|
20,543 |
|
|
16,211 |
|
|
36,754 |
|
|
16,078 |
|
|
17,928 |
|
|
34,006 |
|
|||||||||
|
Gross margin |
42,943 |
|
|
20,200 |
|
|
63,143 |
|
|
42,981 |
|
|
21,480 |
|
|
64,461 |
|
|
36,938 |
|
|
8,699 |
|
|
45,637 |
|
|||||||||
|
Sales, general and administrative |
21,920 |
|
|
17,423 |
|
|
39,343 |
|
|
21,265 |
|
|
14,494 |
|
|
35,759 |
|
|
17,492 |
|
|
14,332 |
|
|
31,824 |
|
|||||||||
|
Research and development |
4,019 |
|
|
14,482 |
|
|
18,501 |
|
|
2,960 |
|
|
12,159 |
|
|
15,119 |
|
|
1,863 |
|
|
11,126 |
|
|
12,989 |
|
|||||||||
|
Income (loss) from operations |
$ |
17,004 |
|
|
$ |
(11,705) |
|
|
$ |
5,299 |
|
|
$ |
18,756 |
|
|
$ |
(5,173) |
|
|
$ |
13,583 |
|
|
$ |
17,583 |
|
|
$ |
(16,759) |
|
|
$ |
824 |
|
|
|
|
|
|
|
|
|
|
|
|
|
|
|
|
|
|
|
|
||||||||||||||||||
|
Gross margin % |
70.8 |
% |
|
52.3 |
% |
|
63.6 |
% |
|
67.7 |
% |
|
57.0 |
% |
|
63.7 |
% |
|
69.7 |
% |
|
32.7 |
% |
|
57.3 |
% |
|||||||||
|
Operating margin % |
28.0 |
% |
|
(30.3)% |
|
|
5.3 |
% |
|
29.5 |
% |
|
(13.7)% |
|
|
13.4 |
% |
|
33.2 |
% |
|
(62.9)% |
|
|
1.0 |
% |
|||||||||
|
|
Six Months Ended June 30, 2018 |
|
Six Months Ended June 30, 2017 (1) |
||||||||||||||||||||
|
|
TASER |
|
Software and Sensors |
|
Total |
|
TASER |
|
Software and Sensors |
|
Total |
||||||||||||
|
Net sales from products (2) |
$ |
124,148 |
|
|
$ |
33,547 |
|
|
$ |
157,695 |
|
|
$ |
110,687 |
|
|
$ |
23,679 |
|
|
$ |
134,366 |
|
|
Net sales from services (3) |
— |
|
|
42,746 |
|
|
42,746 |
|
|
— |
|
|
24,519 |
|
|
24,519 |
|
||||||
|
Net sales |
124,148 |
|
|
76,293 |
|
|
200,441 |
|
|
110,687 |
|
|
48,198 |
|
|
158,885 |
|
||||||
|
Cost of product sales |
38,224 |
|
|
25,297 |
|
|
63,521 |
|
|
34,104 |
|
|
23,140 |
|
|
57,244 |
|
||||||
|
Cost of service sales |
— |
|
|
9,316 |
|
|
9,316 |
|
|
— |
|
|
7,334 |
|
|
7,334 |
|
||||||
|
Cost of sales |
38,224 |
|
|
34,613 |
|
|
72,837 |
|
|
34,104 |
|
|
30,474 |
|
|
64,578 |
|
||||||
|
Gross margin |
85,924 |
|
|
41,680 |
|
|
127,604 |
|
|
76,583 |
|
|
17,724 |
|
|
94,307 |
|
||||||
|
Sales, general and administrative |
43,185 |
|
|
31,917 |
|
|
75,102 |
|
|
34,708 |
|
|
27,973 |
|
|
62,681 |
|
||||||
|
Research and development |
6,979 |
|
|
26,641 |
|
|
33,620 |
|
|
4,075 |
|
|
21,377 |
|
|
25,452 |
|
||||||
|
Income (loss) from operations |
$ |
35,760 |
|
|
$ |
(16,878) |
|
|
$ |
18,882 |
|
|
$ |
37,800 |
|
|
$ |
(31,626) |
|
|
$ |
6,174 |
|
|
|
|
|
|
|
|
|
|
|
|
|
|
||||||||||||
|
Gross margin % |
69.2 |
% |
|
54.6 |
% |
|
63.7 |
% |
|
69.2 |
% |
|
36.8 |
% |
|
59.4 |
% |
||||||
|
Operating margin % |
28.8 |
% |
|
(22.1)% |
|
|
9.4 |
% |
|
34.2 |
% |
|
(65.6)% |
|
|
3.9 |
% |
||||||
|
|
|
(1) Amounts for the three and six months ended June 30, 2017 have not been adjusted under the modified retrospective method of adoption of Topic 606, and are presented consistent with the prior period amounts reported under ASC 605. |
|
|
|
(2) Software and Sensors "products" revenue consists of sensors, including on-officer body cameras, Axon Fleet cameras, other hardware sensors, warranties on sensors, and other products, and is sometimes referred to as Sensors and Other revenue. |
|
|
|
(3) Software and Sensors "services" revenue comprises sales related to the Axon Cloud, which includes Evidence.com, cloud-based evidence management software revenue, other recurring cloud-hosted software revenue and related professional services, and is sometimes referred to as Axon Cloud revenue. |
|
AXON ENTERPRISE, INC. Software and Sensors Key Metrics by Quarter (Unaudited) (dollars in thousands) |
|||||||||||||||||||
|
|
|||||||||||||||||||
|
|
June 30, 2018 |
|
March 31, 2018 |
|
December 31, 2017 |
|
September 30, 2017 |
|
June 30, 2017 |
||||||||||
|
|
|
|
|
|
|
|
|
|
|
||||||||||
|
Bookings |
$ |
88,860 |
|
|
$ |
97,528 |
|
|
$ |
71,154 |
|
|
$ |
77,976 |
|
|
$ |
81,942 |
|
|
Software and Sensors Annual Recurring Revenue (1) |
$ |
92,711 |
|
|
$ |
83,310 |
|
|
$ |
69,960 |
|
|
$ |
63,694 |
|
|
$ |
54,683 |
|
|
Cumulative Axon Cloud seats booked |
305,200 |
|
|
226,900 |
|
|
201,500 |
|
|
187,400 |
|
|
169,000 |
|
|||||
|
|
|
(1) Monthly recurring license, integration, warranty, and storage revenue annualized. |
|
AXON ENTERPRISE, INC. UNIT SALES STATISTICS (Unaudited) Units in whole numbers |
|||||||||||||||||||||||
|
|
|||||||||||||||||||||||
|
|
Three Months Ended June 30, |
|
Six Months Ended June 30, |
||||||||||||||||||||
|
|
2018 |
|
2017 |
|
Unit Change |
|
Percent Change |
|
2018 |
|
2017 |
|
Unit Change |
|
Percent Change |
||||||||
|
|
|
|
|
|
|
|
|
|
|
|
|
|
|
|
|
||||||||
|
TASER X26P |
18,664 |
|
|
18,198 |
|
|
466 |
|
|
2.6 |
% |
|
34,384 |
|
|
33,559 |
|
|
825 |
|
|
2.5 |
% |
|
TASER X2 |
15,537 |
|
|
15,390 |
|
|
147 |
|
|
1.0 |
|
|
36,038 |
|
|
32,527 |
|
|
3,511 |
|
|
10.8 |
|
|
TASER Pulse and Bolt |
3,158 |
|
|
2,347 |
|
|
811 |
|
|
34.6 |
|
|
7,158 |
|
|
5,919 |
|
|
1,239 |
|
|
20.9 |
|
|
Cartridges |
611,136 |
|
|
579,282 |
|
|
31,854 |
|
|
5.5 |
|
|
1,144,088 |
|
|
1,175,268 |
|
|
(31,180) |
|
|
(2.7) |
|
|
Axon Body |
20,407 |
|
|
26,882 |
|
|
(6,475) |
|
|
(24.1) |
|
|
42,176 |
|
|
47,195 |
|
|
(5,019) |
|
|
(10.6) |
|
|
Axon Flex |
3,281 |
|
|
9,373 |
|
|
(6,092) |
|
|
(65.0) |
|
|
6,974 |
|
|
12,474 |
|
|
(5,500) |
|
|
(44.1) |
|
|
Axon Fleet |
2,079 |
|
|
— |
|
|
2,079 |
|
|
* |
|
|
3,936 |
|
|
— |
|
|
3,936 |
|
|
* |
|
|
Axon Dock |
4,534 |
|
|
8,269 |
|
|
(3,735) |
|
|
(45.2) |
|
|
10,378 |
|
|
13,144 |
|
|
(2,766) |
|
|
(21.0) |
|
|
TASER Cam |
1,491 |
|
|
1,336 |
|
|
155 |
|
|
11.6 |
|
|
5,019 |
|
|
2,675 |
|
|
2,344 |
|
|
87.6 |
|
|
|
|||||||||||||||||||||||
|
* Not meaningful |
|||||||||||||||||||||||
|
AXON ENTERPRISE, INC. RECONCILIATION OF GAAP TO NON-GAAP FINANCIAL MEASURES (Unaudited) Dollars in thousands |
|||||||||||||||||||
|
|
|||||||||||||||||||
|
|
Three Months Ended |
|
Six Months Ended June 30, |
||||||||||||||||
|
|
June 30, 2018 |
|
March 31, 2018 |
|
June 30, |
|
2018 |
|
2017 (1) |
||||||||||
|
EBITDA and adjusted EBITDA: |
|
|
|
|
|
|
|
|
|
||||||||||
|
Net income |
$ |
8,485 |
|
|
$ |
12,926 |
|
|
$ |
2,276 |
|
|
$ |
21,411 |
|
|
$ |
6,856 |
|
|
Depreciation and amortization |
2,750 |
|
|
2,411 |
|
|
1,796 |
|
|
5,161 |
|
|
3,400 |
|
|||||
|
Interest expense |
17 |
|
|
20 |
|
|
45 |
|
|
37 |
|
|
83 |
|
|||||
|
Investment interest income |
(595) |
|
|
(75) |
|
|
(221) |
|
|
(670) |
|
|
(488) |
|
|||||
|
Provision for (benefit from) income taxes |
(3,481) |
|
|
1,920 |
|
|
232 |
|
|
(1,561) |
|
|
1,208 |
|
|||||
|
EBITDA |
$ |
7,176 |
|
|
$ |
17,202 |
|
|
$ |
4,128 |
|
|
$ |
24,378 |
|
|
$ |
11,059 |
|
|
|
|
|
|
|
|
|
|
|
|
||||||||||
|
Adjustments: |
|
|
|
|
|
|
|
|
|
||||||||||
|
Stock-based compensation expense |
$ |
4,954 |
|
|
$ |
4,093 |
|
|
$ |
3,976 |
|
|
$ |
9,047 |
|
|
$ |
7,423 |
|
|
Non-recurring transaction costs and adjustments related to business acquisition |
1,382 |
|
|
— |
|
|
— |
|
|
1,382 |
|
|
— |
|
|||||
|
Loss on disposal and abandonment of intangible assets |
54 |
|
|
— |
|
|
— |
|
|
54 |
|
|
— |
|
|||||
|
Loss on disposal and impairment of property and equipment, net |
119 |
|
|
34 |
|
|
— |
|
|
153 |
|
|
— |
|
|||||
|
Adjusted EBITDA |
$ |
13,685 |
|
|
$ |
21,329 |
|
|
$ |
8,104 |
|
|
$ |
35,014 |
|
|
$ |
18,482 |
|
|
Net income as a percentage of net sales |
8.6 |
% |
|
12.8 |
% |
|
2.9 |
% |
|
10.7 |
% |
|
4.3 |
% |
|||||
|
Adjusted EBITDA as a percentage of net sales |
13.8 |
% |
|
21.1 |
% |
|
10.2 |
% |
|
17.5 |
% |
|
11.6 |
% |
|||||
|
|
|
(1) Amounts for the three and six months ended June 30, 2017 have not been adjusted under the modified retrospective method of adoption of Topic 606, and are presented consistent with the prior period amounts reported under ASC 605. |
|
AXON ENTERPRISE, INC. RECONCILIATION OF GAAP TO NON-GAAP FINANCIAL MEASURES - continued (Unaudited) Dollars in thousands |
|||||||||||||||||||
|
|
|
|
|
||||||||||||||||
|
|
Three Months Ended |
|
Six Months Ended June 30, |
||||||||||||||||
|
|
June 30, 2018 |
|
March 31, 2018 |
|
June 30, |
|
2018 |
|
2017 (1) |
||||||||||
|
Non-GAAP net income: |
|
|
|
|
|
|
|
|
|
||||||||||
|
GAAP net income |
$ |
8,485 |
|
|
$ |
12,926 |
|
|
$ |
2,276 |
|
|
$ |
21,411 |
|
|
$ |
6,856 |
|
|
Non-GAAP adjustments: |
|
|
|
|
|
|
|
|
|
||||||||||
|
Stock-based compensation expense |
4,954 |
|
|
4,093 |
|
|
3,976 |
|
|
9,047 |
|
|
7,423 |
|
|||||
|
Loss on disposal and abandonment of intangible assets |
54 |
|
|
— |
|
|
— |
|
|
54 |
|
|
— |
|
|||||
|
Loss on disposal and impairment of property and equipment, net |
119 |
|
|
34 |
|
|
— |
|
|
153 |
|
|
— |
|
|||||
|
Non-recurring transaction costs and adjustments related to business acquisition |
1,382 |
|
|
— |
|
|
— |
|
|
1,382 |
|
|
— |
|
|||||
|
Income tax effects |
(1,580) |
|
|
(1,002) |
|
|
(1,492) |
|
|
(2,581) |
|
|
(2,785) |
|
|||||
|
Income tax benefit of CEO stock option exercise |
(3,362) |
|
|
— |
|
|
— |
|
|
(3,362) |
|
|
— |
|
|||||
|
Non-GAAP net income |
$ |
10,052 |
|
|
$ |
16,051 |
|
|
$ |
4,760 |
|
|
$ |
26,104 |
|
|
$ |
11,494 |
|
|
|
Three Months Ended |
|
Six Months Ended June 30, |
||||||||||||||||
|
|
June 30, 2018 |
|
March 31, 2018 |
|
June 30, |
|
2018 |
|
2017 (1) |
||||||||||
|
Non-GAAP diluted earnings per share: |
|
|
|
|
|
|
|
|
|
||||||||||
|
GAAP diluted earnings per share |
$ |
0.15 |
|
|
$ |
0.24 |
|
|
$ |
0.04 |
|
|
$ |
0.38 |
|
|
$ |
0.13 |
|
|
Non-GAAP adjustments: |
|
|
|
|
|
|
|
|
|
||||||||||
|
Stock-based compensation expense |
0.09 |
|
|
0.08 |
|
|
0.07 |
|
|
0.16 |
|
|
0.14 |
|
|||||
|
Loss on disposal and abandonment of intangible assets |
0.00 |
|
|
— |
|
|
— |
|
|
0.00 |
|
|
— |
|
|||||
|
Loss on disposal and impairment of property and equipment, net |
0.00 |
|
|
0.00 |
|
|
— |
|
|
0.00 |
|
|
— |
|
|||||
|
Non-recurring transaction costs and adjustments related to business acquisition |
0.02 |
|
|
— |
|
|
— |
|
|
0.02 |
|
|
— |
|
|||||
|
Income tax effects |
(0.03) |
|
|
(0.02) |
|
|
(0.03) |
|
|
(0.05) |
|
|
(0.05) |
|
|||||
|
Income tax benefit of CEO stock option exercise |
(0.06) |
|
|
— |
|
|
— |
|
|
(0.06) |
|
|
— |
|
|||||
|
Non-GAAP diluted earnings per share (2) |
$ |
0.18 |
|
|
$ |
0.29 |
|
|
$ |
0.09 |
|
|
$ |
0.47 |
|
|
$ |
0.21 |
|
|
|
|
|
|
|
|
|
|
|
|
||||||||||
|
Weighted average number of diluted common and common equivalent shares outstanding (in thousands) |
57,054 |
|
|
54,532 |
|
|
53,770 |
|
|
55,892 |
|
|
53,723 |
|
|||||
|
|
|
(1) Amounts for the three and six months ended June 30, 2017 have not been adjusted under the modified retrospective method of adoption of Topic 606, and are presented consistent with the prior period amounts reported under ASC 605. |
|
(2) The per share calculations for GAAP net income, Non-GAAP adjustments and Non-GAAP diluted earnings per share are each computed independently. Per share amounts may not sum due to rounding. |
|
AXON ENTERPRISE, INC. CONDENSED CONSOLIDATED BALANCE SHEETS (in thousands) |
|||||||
|
|
|||||||
|
|
June 30, 2018 |
|
December 31, 2017 |
||||
|
|
(Unaudited) |
|
|
||||
|
ASSETS |
|||||||
|
Current Assets: |
|
|
|
||||
|
Cash and cash equivalents |
$ |
307,507 |
|
|
$ |
75,105 |
|
|
Short-term investments |
4,124 |
|
|
6,862 |
|
||
|
Accounts and notes receivable, net |
94,296 |
|
|
56,064 |
|
||
|
Contract assets, net |
10,468 |
|
|
— |
|
||
|
Inventory |
43,967 |
|
|
45,465 |
|
||
|
Prepaid expenses and other current assets |
26,604 |
|
|
21,696 |
|
||
|
Total current assets |
486,966 |
|
|
205,192 |
|
||
|
|
|
|
|
||||
|
Property and equipment, net |
34,503 |
|
|
31,172 |
|
||
|
Deferred income tax assets, net |
15,813 |
|
|
15,755 |
|
||
|
Intangible assets, net |
20,442 |
|
|
18,823 |
|
||
|
Goodwill |
24,684 |
|
|
14,927 |
|
||
|
Long-term notes receivable, net of current portion |
37,158 |
|
|
36,877 |
|
||
|
Other assets |
22,831 |
|
|
15,366 |
|
||
|
Total assets |
$ |
642,397 |
|
|
$ |
338,112 |
|
|
|
|
|
|
||||
|
LIABILITIES AND STOCKHOLDERS' EQUITY |
|||||||
|
Current Liabilities: |
|
|
|
||||
|
Accounts payable |
$ |
9,213 |
|
|
$ |
8,592 |
|
|
Accrued liabilities |
29,995 |
|
|
23,502 |
|
||
|
Current portion of deferred revenue |
76,583 |
|
|
70,401 |
|
||
|
Customer deposits |
2,970 |
|
|
3,673 |
|
||
|
Current portion of business acquisition contingent consideration |
1,946 |
|
|
1,693 |
|
||
|
Other current liabilities |
191 |
|
|
89 |
|
||
|
Total current liabilities |
120,898 |
|
|
107,950 |
|
||
|
|
|
|
|
||||
|
Deferred revenue, net of current portion |
61,456 |
|
|
54,881 |
|
||
|
Liability for unrecognized tax benefits |
1,918 |
|
|
1,706 |
|
||
|
Long-term deferred compensation |
3,560 |
|
|
3,859 |
|
||
|
Business acquisition contingent consideration, net of current portion |
203 |
|
|
1,048 |
|
||
|
Other long-term liabilities |
5,520 |
|
|
1,224 |
|
||
|
Total liabilities |
193,555 |
|
|
170,668 |
|
||
|
|
|
|
|
||||
|
Stockholders' Equity: |
|
|
|
||||
|
Preferred stock |
— |
|
|
— |
|
||
|
Common stock |
1 |
|
|
1 |
|
||
|
Additional paid-in capital |
442,717 |
|
|
201,672 |
|
||
|
Treasury stock |
(155,947) |
|
|
(155,947) |
|
||
|
Retained earnings |
163,590 |
|
|
123,185 |
|
||
|
Accumulated other comprehensive income |
(1,519) |
|
|
(1,467) |
|
||
|
Total stockholders' equity |
448,842 |
|
|
167,444 |
|
||
|
Total liabilities and stockholders' equity |
$ |
642,397 |
|
|
$ |
338,112 |
|
|
AXON ENTERPRISE, INC. SELECTED CASH FLOW INFORMATION (Unaudited) (in thousands) |
|||||||||||||||||||
|
|
|||||||||||||||||||
|
|
Three Months Ended |
|
Six Months Ended June 30, |
||||||||||||||||
|
|
June 30, 2018 |
|
March 31, 2018 |
|
June 30, |
|
2018 |
|
2017 (1) |
||||||||||
|
|
|
|
|
|
|
|
|
|
|
||||||||||
|
Net income |
$ |
8,485 |
|
|
$ |
12,926 |
|
|
$ |
2,276 |
|
|
$ |
21,411 |
|
|
$ |
6,856 |
|
|
Depreciation and amortization |
2,750 |
|
|
2,411 |
|
|
1,796 |
|
|
5,161 |
|
|
3,400 |
|
|||||
|
Stock-based compensation |
4,954 |
|
|
4,093 |
|
|
3,976 |
|
|
9,047 |
|
|
7,423 |
|
|||||
|
Net cash provided by (used in) operating activities |
(1,947) |
|
|
18,053 |
|
|
(5,849) |
|
|
16,106 |
|
|
(12,458) |
|
|||||
|
Net cash provided by (used in) investing activities |
(8,494) |
|
|
1,268 |
|
|
(7,847) |
|
|
(7,226) |
|
|
2,037 |
|
|||||
|
Net cash provided by (used in) financing activities |
226,627 |
|
|
(3,430) |
|
|
546 |
|
|
223,197 |
|
|
(1,331) |
|
|||||
|
Cash, cash equivalents and restricted cash, end of period |
309,977 |
|
|
94,798 |
|
|
31,360 |
|
|
309,977 |
|
|
31,360 |
|
|||||
|
|
Three Months Ended |
|
Six Months Ended June 30, |
||||||||||||||||
|
|
June 30, 2018 |
|
March 31, 2018 |
|
June 30, |
|
2018 |
|
2017 (1) |
||||||||||
|
|
|
|
|
|
|
|
|
|
|
||||||||||
|
Net cash provided by (used in) operating activities |
$ |
(1,947) |
|
|
$ |
18,053 |
|
|
$ |
(5,849) |
|
|
$ |
16,106 |
|
|
$ |
(12,458) |
|
|
Purchases of property and equipment |
(3,602) |
|
|
(1,063) |
|
|
(3,398) |
|
|
(4,665) |
|
|
(5,741) |
|
|||||
|
Purchases of intangible assets |
(220) |
|
|
(34) |
|
|
(75) |
|
|
(254) |
|
|
(170) |
|
|||||
|
Cash flows related to business acquisitions |
(5,014) |
|
|
— |
|
|
— |
|
|
(5,014) |
|
|
(6,479) |
|
|||||
|
Free cash flow (deficit), a non-GAAP measure |
$ |
(10,783) |
|
|
$ |
16,956 |
|
|
$ |
(9,322) |
|
|
$ |
6,173 |
|
|
$ |
(24,848) |
|
|
|
|
(1) Amounts for the three and six months ended June 30, 2017 have not been adjusted under the modified retrospective method of adoption of Topic 606, and are presented consistent with the prior period amounts reported under ASC 605. |
CONTACT:
Investor Relations
Axon Enterprise, Inc.
IR@axon.com
![]()
![]() View original content with multimedia:http://www.prnewswire.com/news-releases/axon-reports-second-quarter-results-software-annual-recurring-revenue-of-93-million-300693387.html
View original content with multimedia:http://www.prnewswire.com/news-releases/axon-reports-second-quarter-results-software-annual-recurring-revenue-of-93-million-300693387.html
SOURCE Axon