Press Releases


SCOTTSDALE, Ariz., Feb. 26, 2019 /PRNewswire/ -- Axon (Nasdaq: AAXN), the global leader in public safety technology, today released the following quarterly update letter to shareholders. Financial performance included the following record results:
- Total company Q4 revenue of $115 million, up 21% YOY
- Axon Cloud revenue of $26 million, up 50% YOY
- International revenue of $24 million, up 52% YOY
- Software & Sensors bookings of $110 million, up 54% YOY
- Full year revenue of $420 million, up 22% YOY
- Full year GAAP operating income of $25 million, up 91% YOY; Adjusted EBITDA of $61 million, up 53% YOY
- Introducing full-year 2019 guidance of $480 million to $490 million in revenue and $80 million to $85 million in Adjusted EBITDA
Dear shareholders,
We delivered a record 2018, executing across multiple fronts. Our strong top-line performance reflects the health of our growing software network, Axon's increasing international presence and our ability to expand into new product categories such as Axon Fleet in-car video. Our bottom line grew twice as fast, reflecting the rigor and cost-discipline we have established over the last 18 months.
We strengthened our balance sheet through strong operating cash generation and the successful completion of a follow-on offering, supporting our goal to continue driving subscription contracts and recurring cash flow growth. Additionally, we acquired body camera provider Vievu in a $7 million upfront cash and stock transaction(1), which added five major city customers and accelerated the largest police department in the US onto the Axon network.
We concluded the year by launching TASER 7, the most significant redesign of the TASER device since 2003, and unveiling our first LTE-connected body camera, Axon Body 3.
Heading into 2019, Axon continues to build a foundation to support our next decade of growth and profitability. Our product and engineering teams are heavily focused on four major or "Alpha" strategic growth areas, with dedicated product leadership. These growth drivers are 1) TASER, 2) Sensors (including the related software), 3) Records (our new records management software), and 4) Dispatch (computer-aided dispatch software).
We've also deployed small, nimble product teams tasked with going after select break-out market opportunities. These scrappy "Delta" teams include Axon Air, which leverages our drone reseller partnership with DJI, our TASER consumer team, which is focused on the self-defense market, and three additional, yet-to-be-announced initiatives.
Additionally, for the first time, we've assigned dedicated sales personnel to markets adjacent to law enforcement, including fire departments and emergency medical services, federal government and military, corrections, private security, and commercial enterprise. Early successes include the Charlotte Fire Department, which is the first major city fire department to deploy Axon body cameras backed by our software network, and Cypress Creek Emergency Medical Services, which is the first EMS provider in the U.S. to deploy our camera solution to paramedics. There, body camera footage from an ambulance has already assisted emergency room doctors in saving lives.
(1) The purchase price of Vievu consisted of $4.6 million in cash and $2.4 million in common stock issued to Safariland at closing. Deal terms also included consideration of up to 141,226 shares of common stock, contingent upon achieving certain milestones over two years, as well as minimum holster purchase commitments.
These market adjacencies offer the potential to grow our total addressable market and drive incremental opportunity beyond our four strategic areas of investment.
In 2019, we expect revenue growth to be driven by new cloud-connected products, including TASER 7 and Axon Fleet 2, both of which are currently shipping, and Axon Body 3, which we expect to begin shipping in the second half. Customer reception to TASER 7 has been exceedingly positive. We've discussed these new products in detail in our previous quarterly letter. Importantly, we expect to continue driving leverage through administrative cost controls, as well as improvements in new customer contract pricing. At the same time, we will continue to invest in R&D to deliver innovation and fuel long-term growth.
Summary of Q4 2018 Results (2)
- Strong quarterly revenue growth of 21% was driven by strength in both segments, particularly Software and Sensors, which saw revenue grow 64% over last year. Several large body camera contracts were executed in Q4 2018, exceeding our expectations. Strength was also driven by new users on Axon Evidence (Evidence.com) and a full quarter of shipping Axon Fleet 2, which we expected. International revenue was also strong in the quarter, up 52% year over year.
- Gross margin of 56.9% includes 360 basis points of impact related to costs associated with Vievu and a related large domestic customer contract.(3) Q4 2018 gross margin was also affected by startup costs associated with initial production of TASER 7. In Q1 2019, we expect gross margins to be in the range of 61% to 63% and build higher over the rest of the year.
- Operating expenses of $63.4 million included $42.1 million in SG&A and $21.3 million in R&D. SG&A included marketing expenses associated with Axon's launch of the TASER 7 and Axon Body 3 at the annual International Association of Chiefs of Police trade show, as well as a $0.7 million incremental charge for Vievu excess purchase commitments.(3) R&D costs declined sequentially on lower professional and consulting expenses, partially offset by increased headcount.
- GAAP EPS was $0.03; Non-GAAP EPS, which excludes $6.6 million in stock based compensation expenses and $2.3 million tax benefit realized from the CEO exercise of stock options, was $0.08.
- Adjusted EBITDA in the quarter was $10.9 million, which reflects both non-recurring and ongoing Vievu-related costs, as well as margin compression on weapons. Our estimated EBITDA losses related to Vievu in Q4 2018 are $6 million (4), of which nearly half are non-recurring and primarily related to the write down of Vievu inventory and an incremental charge related to excess purchase commitments in connection with a large domestic customer. (3) For the full year 2018, we achieved adjusted EBITDA margin of 14.6%, within our guidance range, despite an approximately 250 basis point impact related to the Vievu acquisition.
(2) Amounts for Q4 2017 have not been adjusted under the modified retrospective method of adoption of Topic 606, and are presented consistent with the prior period amounts reported under ASC 605. Revenue for Q4 2018 would have been $114.2 million under ASC 605.
(3) After Axon acquired Vievu in May 2018, we began migrating several Vievu customers over to the Axon network. One large domestic customer accelerated its move to the Axon network in Q4 2018, resulting in excess inventory write downs and charges for excess purchase commitments in the period.
(4) Our estimate of EBITDA losses related to Vievu includes those direct costs incurred by the Vievu legal entity plus legacy Vievu employee costs. It does not include any other costs of supporting the acquired Vievu customers.
Financial commentary by segment
TASER:
|
|
Three Months Ended |
|
Change |
||||||||||||||
|
|
December 31, |
|
September 30, |
|
December 31, |
|
QoQ |
|
YoY |
||||||||
|
TASER |
|
|
|
|
|
|
|
|
|
||||||||
|
Net sales |
$ |
65,301 |
|
|
$ |
63,666 |
|
|
$ |
64,409 |
|
|
2.6 |
% |
|
1.4 |
% |
|
Gross margin |
65.0 |
% |
|
69.8 |
% |
|
70.9 |
% |
|
-480bp |
|
-590bp |
|||||
|
|
|
|
|
|
|
|
|
|
|
|
|
|
|
|
|
|
|
|
|
|
(1) Amounts for the three months ended December 31, 2017 have not been adjusted under the modified retrospective method of adoption of Topic 606, and are presented consistent with the prior period amounts reported under ASC 605. |
- TASER revenue of $65.3 million included $7.4 million in TASER 7 sales, which began shipping in early December.
- TASER gross margin of 65% included higher-than-usual production costs associated with ramping the all-new TASER 7 and cartridges. We expect TASER gross margin to build back gradually to historical levels as the mix of revenue recognition shifts toward recurring cartridge and software revenue, as TASER 7 matures and as the customer trade-in credit phases down.
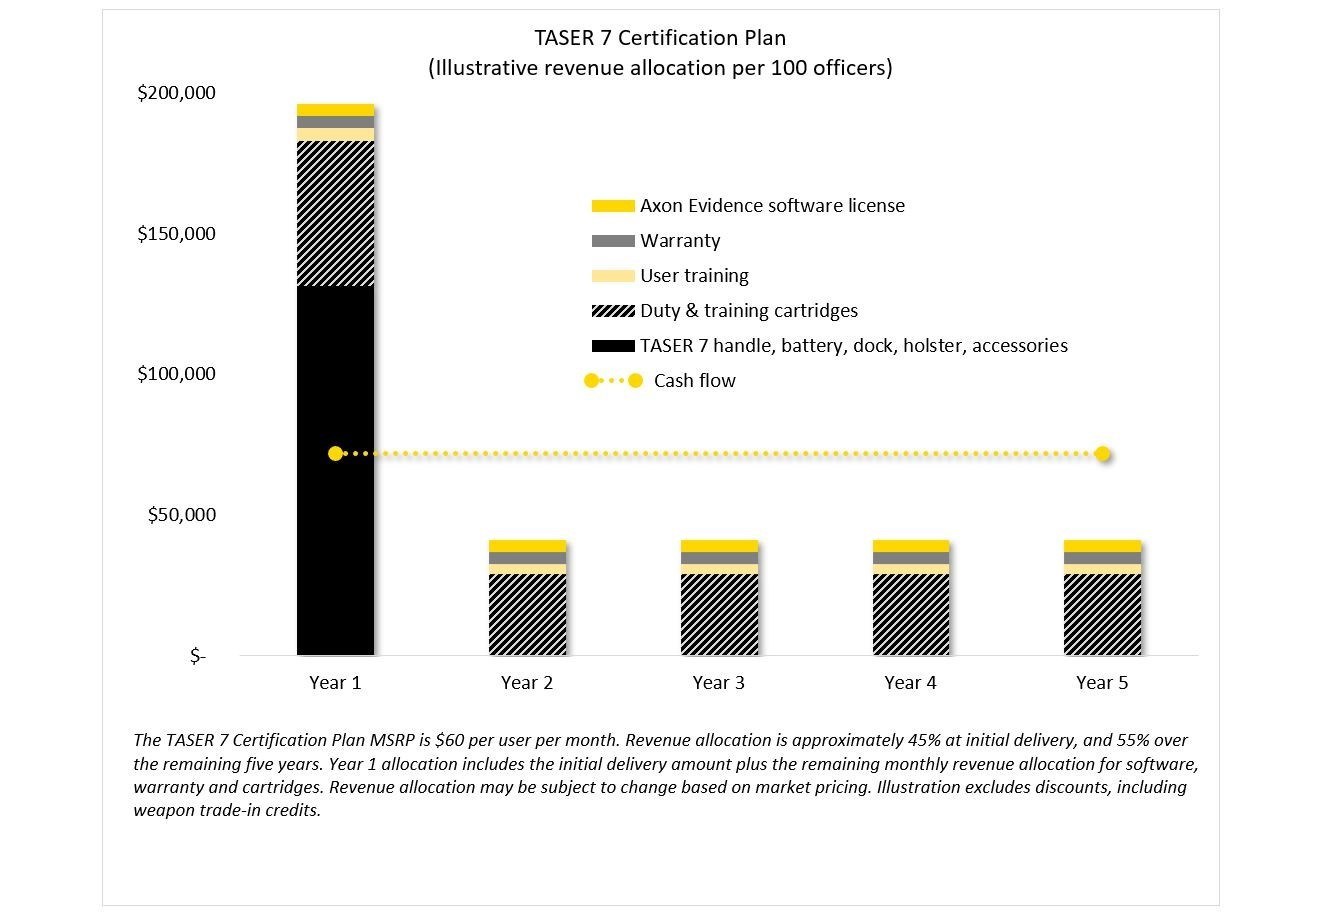
- About 35% of all weapons sold in Q4 were on a recurring payment plan. In the United States, recurring payment plans accounted for 48% of new TASER contracts.
- The following illustration depicts revenue recognition and cash flow on Axon's TASER 7 Certification Plan, which carries an MSRP of $60 per user per month. Note that 45% of the revenue is recognized at the time of sale and the remainder is recognized over the five-year contract.

Software & Sensors:
|
|
Three Months Ended |
|
Change |
||||||||||||||
|
|
December 31, |
|
September 30, |
|
December 31, |
|
QoQ |
|
YoY |
||||||||
|
Software and Sensors |
|
|
|
|
|
|
|
|
|
||||||||
|
Axon Cloud net sales |
$ |
25,774 |
|
|
$ |
23,913 |
|
|
$ |
17,143 |
|
|
7.8 |
% |
|
50.3 |
% |
|
Axon Cloud gross margin |
74.5 |
% |
|
73.9 |
% |
|
68.2 |
% |
|
60bp |
|
630bp |
|||||
|
|
|
|
|
|
|
|
|
|
|
||||||||
|
Sensors and Other net sales |
$ |
23,716 |
|
|
$ |
17,257 |
|
|
$ |
13,099 |
|
|
37.4 |
% |
|
81.1 |
% |
|
Sensors and Other gross margin |
15.7 |
% |
|
20.6 |
% |
|
43.0 |
% |
|
-490bp |
|
-2,730bp |
|||||
|
|
|
(1) Amounts for the three months ended December 31, 2017 have not been adjusted under the modified retrospective method of adoption of Topic 606, and are presented consistent with the prior period amounts reported under ASC 605. |
- Axon Cloud revenue of $25.8 million grew 50% year over year as Axon brought new Axon Evidence users online.
- Axon Cloud gross margin of 74.5% increased sequentially and year over year.
- Sensors and Other revenue of $23.7 million was boosted by international strength and shipments of Axon Fleet 2, with Axon Fleet hardware units increasing 78% year over year.
- Sensors and Other gross margin of 15.7% reflects gross profit of $3.7 million, and was unfavorably impacted by $1.9 million of non-recurring items related to Vievu. Excluding these items, Sensors and Other gross margin would have been 23.7%.
|
|
December 31, |
|
September 30, |
|
June 30, |
|
March 31, |
|
December 31, |
||||||||||
|
|
|
|
|
|
|
|
|
|
|
||||||||||
|
Software and Sensors Bookings |
$ |
109,779 |
|
|
$ |
92,895 |
|
|
$ |
88,860 |
|
|
$ |
97,528 |
|
|
$ |
71,154 |
|
|
Software and Sensors Annual Recurring Revenue (1) |
$ |
108,496 |
|
|
$ |
101,618 |
|
|
$ |
92,711 |
|
|
$ |
83,310 |
|
|
$ |
69,960 |
|
|
Cumulative Axon Cloud seats booked |
347,200 |
|
|
325,200 |
|
|
305,200 |
|
|
226,900 |
|
|
201,500 |
|
|||||
|
|
|
(1) Monthly recurring license, integration, warranty, and storage revenue annualized. |
- Software and Sensors bookings were a record $110 million, reflecting strength across product offerings, including domestic body cameras and Axon Fleet 2.
- Note that annual recurring revenue of $108 million is driven by only that portion of Axon's 347,200 booked seats that are online and contributing to revenue.
- Software and Sensors backlog of $758 million grew 41% year over year.
Outlook:
For full year 2019, we expect to achieve:
- Revenue of $480 million to $490 million;
- We expect to deliver significantly higher growth rates in the second half of 2019, driven by an anticipated pick up in TASER 7 shipments and initial Axon Body 3 shipments. Q1 2019 revenue is expected to increase approximately 8% to 9% year over year
- Adjusted EBITDA of $80 million to $85 million; and
- A normalized tax rate of 20% to 25%, which can fluctuate depending on geography of income and the effects of discrete items, including changes in our stock price.
- Note: Axon is increasingly leveraging our strategic advantage with TASER devices and body cameras by bundling our product offerings and developing hardware devices that connect to our software. The level of integration across our business means that much of our sales, marketing, and administrative expenses support both segments. Thus, starting with our Q1 2019 disclosures, we will no longer break out SG&A by segment, but we will continue to provide revenue, gross margin and R&D by segment.
We look forward to updating you throughout the year as we ship new products, gain a foothold and delight our early customers in Axon Records, and drive leverage on the bottom line.
Signed,
Rick Smith, CEO
Luke Larson, President
Jawad Ahsan, CFO
Quarterly conference call and Webcast
We will host our Q4 2018 earnings conference call on February 26 at 2 p.m. PT / 3 p.m. AZT / 5 p.m. ET.
The call will be available via live audio webcast and archived replay on Axon's investor relations website at https://investor.axon.com.
Statistical Definitions
Software & Sensors bookings are an indication of the activity the Company is seeing relative to Software & Sensors hardware, software and Axon Evidence. We consider bookings to be a statistical measure defined as the sales price of orders (not invoiced sales), including contractual optional periods we expect to be exercised, net of cancellations, placed in the relevant fiscal period, regardless of when the products or services ultimately will be provided. Most bookings will be invoiced in subsequent periods.
Due to municipal government funding rules, in some cases certain of the future period amounts included in bookings are subject to budget appropriation or other contract cancellation clauses. Although Axon has entered into contracts for the delivery of products and services in the future and anticipates the contracts will be fulfilled, if agencies do not exercise contractual options, do not appropriate money in future year budgets or do enact a cancellation clause, revenue associated with these bookings may not ultimately be recognized, resulting in a future reduction to bookings.
For more information relative to our revenue recognition policies, please reference our SEC filings.
Non-GAAP Measures
To supplement the Company's financial results presented in accordance with GAAP, we present the non-GAAP financial measures of EBITDA, Adjusted EBITDA, Non-GAAP Net Income, Non-GAAP Diluted Earnings Per Share and Free Cash Flow. The Company's management uses these non-GAAP financial measures in evaluating the Company's performance in comparison to prior periods. We believe that both management and investors benefit from referring to these non-GAAP financial measures in assessing its performance, and when planning and forecasting our future periods. A reconciliation of GAAP to the non-GAAP financial measures is presented herein.
- EBITDA (Most comparable GAAP Measure: Net income) - Earnings before interest expense, investment interest income, income taxes, depreciation and amortization.
- Adjusted EBITDA (Most comparable GAAP Measure: Net income) - Earnings before interest expense, investment interest income, income taxes, depreciation, amortization, non-cash stock-based compensation expense and pre-tax certain other items (described below).
- Non-GAAP Net Income (Most comparable GAAP Measure: Net income) - Net income excluding the costs of non-cash stock-based compensation and excluding pre-tax certain other items, including, but not limited to, net gain/loss/write-down/disposal/abandonment of property, equipment and intangible assets; loss on impairment; and costs related to business acquisitions. The Company tax-effects non-GAAP adjustments using the blended statutory federal and state tax rates for each period presented.
- Non-GAAP Diluted Earnings Per Share (Most comparable GAAP Measure: Earnings Per share) - Measure of Company's Non-GAAP Net Income divided by the weighted average number of diluted common shares outstanding during the period presented.
- Free Cash Flow (Most comparable GAAP Measure: Cash flow from operating activities) - cash flows provided by operating activities minus purchases of property and equipment, intangible assets and cash flows related to business acquisitions.
Caution on Use of Non-GAAP Measures
Although these non-GAAP financial measures are not consistent with GAAP, management believes investors will benefit by referring to these non-GAAP financial measures when assessing the Company's operating results, as well as when forecasting and analyzing future periods. However, management recognizes that:
- these non-GAAP financial measures are limited in their usefulness and should be considered only as a supplement to the Company's GAAP financial measures;
- these non-GAAP financial measures should not be considered in isolation from, or as a substitute for, the Company's GAAP financial measures;
- these non-GAAP financial measures should not be considered to be superior to the Company's GAAP financial measures; and
- these non-GAAP financial measures were not prepared in accordance with GAAP and investors should not assume that the non-GAAP financial measures presented in this earnings release were prepared under a comprehensive set of rules or principles.
Further, these non-GAAP financial measures may be unique to the Company, as they may be different from similarly titled non-GAAP financial measures used by other companies. As such, this presentation of non-GAAP financial measures may not enhance the comparability of the Company's results to the results of other companies.
About Axon
Axon is a network of devices, apps, and people that helps public safety personnel become smarter and safer. With a mission of protecting life, our technologies give customers the confidence, focus and time they need to keep their communities safe. Our products impact every aspect of a public safety officer's day-to-day experience.
We work hard for those who put themselves in harm's way for all of us. To date, there are more than 347,200 software seats booked on the Axon network around the world and more than 212,000 lives and countless dollars have been saved with the Axon network of devices, apps and people. Learn more at www.axon.com or by calling (800) 978-2737.
DJI is a trademark of DJI, Facebook is a trademark of Facebook, Inc., and Twitter is a trademark of Twitter, Inc.
Axon, Axon Body 3, Axon Evidence, Axon Fleet, Axon Fleet 2, TASER 7, Vievu, Protect Life and the Delta Logo are trademarks of Axon Enterprise, Inc., some of which are registered in the US and other countries. For more information, visit www.axon.com/legal. All rights reserved.
Follow Axon here:
Axon on Twitter: https://twitter.com/axon_us
Axon on Facebook: https://www.facebook.com/Axon.ProtectLife/
Forward-looking statements
These forward-looking statements include, without limitation, statements regarding: proposed products and services and related development efforts and activities; expectations about the market for our current and future products and services; expectations about customer behavior; statements concerning projections, predictions, expectations, estimates or forecasts as to our business, financial and operational results and future economic performance; and statements of management's strategies, goals and objectives and other similar expressions; as well as the ultimate resolution of financial statement items requiring critical accounting estimates, including those set forth in our Form 10-K for the year ended December 31, 2017 and the soon-to-be-filed Form 10-K for the year ended December 31, 2018. Such statements give our current expectations or forecasts of future events; they do not relate strictly to historical or current facts. Words such as "may," "will," "should," "could," "would," "predict," "potential," "continue," "expect," "anticipate," "future," "intend," "plan," "believe," "estimate," and similar expressions, as well as statements in future tense, identify forward-looking statements. However, not all forward-looking statements contain these identifying words.
We cannot guarantee that any forward-looking statement will be realized, although we believe we have been prudent in our plans and assumptions. Achievement of future results is subject to risks, uncertainties and potentially inaccurate assumptions. The following important factors could cause actual results to differ materially from those in the forward-looking statements: customer purchase behavior, including adoption of our software as a service delivery model; our exposure to cancellations of government contracts due to appropriation clauses, exercise of a cancellation clause, or non-exercise of contractually optional periods; our ability to design, introduce and sell new products or features; our ability to manage our supply chain and avoid production delays or shortages; changes in the costs of product components and labor; defects in our products; the impact of product mix on projected gross margins; loss of customer data, a breach of security or an extended outage, including our reliance on third party cloud-based storage providers; negative media publicity regarding our products; our ability to defend against litigation and protect our intellectual property, and the resulting costs of this activity; changes in government regulations in the U.S. and in foreign markets, especially related to the classification of our product by the United States Bureau of Alcohol, Tobacco, Firearms and Explosives; counter-party risks relating to cash balances held in excess of FDIC insurance limits; our ability to integrate acquired businesses; and our ability to attract and retain key personnel. Many events beyond our control may determine whether results we anticipate will be achieved. Should known or unknown risks or uncertainties materialize, or should underlying assumptions prove inaccurate, actual results could differ materially from past results and those anticipated, estimated or projected. You should bear this in mind as you consider forward-looking statements. Our Annual Report on Form 10-K lists various important factors that could cause actual results to differ materially from expected and historical results. These factors are intended as cautionary statements for investors within the meaning of Section 21E of the Exchange Act and Section 27A of the Securities Act. Readers can find them under the heading "Risk Factors" in the Report on Form 10-K and in the Report on Form 10-Q, and investors should refer to them. You should understand that it is not possible to predict or identify all such factors. Consequently, you should not consider any such list to be a complete set of all potential risks or uncertainties.
Except as required by law, we undertake no obligation to publicly update forward-looking statements, whether as a result of new information, future events or otherwise. You are advised, however, to consult any further disclosures we make on related subjects in our Form 10-Q, 8-K and 10-K reports to the SEC.
Please visit https://investor.axon.com, https://www.axon.com/press, www.twitter.com/axon_us and https://www.facebook.com/Axon.ProtectLife/ where Axon discloses information about the company, its financial information, and its business.
For investor relations information please contact Andrea James via email at IR@axon.com.
|
AXON ENTERPRISE, INC. |
|||||||||||||||||||
|
CONSOLIDATED STATEMENTS OF OPERATIONS |
|||||||||||||||||||
|
(Unaudited) |
|||||||||||||||||||
|
(in thousands, except per share data) |
|||||||||||||||||||
|
|
|||||||||||||||||||
|
|
Three Months Ended |
|
Twelve Months Ended December 31, |
||||||||||||||||
|
|
December 31, |
|
September 30, |
|
December 31, |
|
2018 |
|
2017 (1) |
||||||||||
|
Net sales from products |
$ |
89,017 |
|
|
$ |
80,923 |
|
|
$ |
77,508 |
|
|
$ |
327,635 |
|
|
$ |
285,859 |
|
|
Net sales from services |
25,774 |
|
|
23,913 |
|
|
17,143 |
|
|
92,433 |
|
|
57,939 |
|
|||||
|
Net sales |
114,791 |
|
|
104,836 |
|
|
94,651 |
|
|
420,068 |
|
|
343,798 |
|
|||||
|
Cost of product sales |
42,863 |
|
|
32,953 |
|
|
26,180 |
|
|
139,337 |
|
|
117,997 |
|
|||||
|
Cost of service sales |
6,582 |
|
|
6,250 |
|
|
5,455 |
|
|
22,148 |
|
|
18,713 |
|
|||||
|
Cost of sales |
49,445 |
|
|
39,203 |
|
|
31,635 |
|
|
161,485 |
|
|
136,710 |
|
|||||
|
Gross margin |
65,346 |
|
|
65,633 |
|
|
63,016 |
|
|
258,583 |
|
|
207,088 |
|
|||||
|
Operating expenses: |
|
|
|
|
|
|
|
|
|
||||||||||
|
Sales, general and administrative |
42,099 |
|
|
39,685 |
|
|
39,613 |
|
|
156,886 |
|
|
138,692 |
|
|||||
|
Research and development |
21,254 |
|
|
21,982 |
|
|
15,755 |
|
|
76,856 |
|
|
55,373 |
|
|||||
|
Total operating expenses |
63,353 |
|
|
61,667 |
|
|
55,368 |
|
|
233,742 |
|
|
194,065 |
|
|||||
|
Income from operations |
1,993 |
|
|
3,966 |
|
|
7,648 |
|
|
24,841 |
|
|
13,023 |
|
|||||
|
Interest and other income (expense), net |
1,021 |
|
|
1,274 |
|
|
(582) |
|
|
3,263 |
|
|
2,738 |
|
|||||
|
Income before provision for income taxes |
3,014 |
|
|
5,240 |
|
|
7,066 |
|
|
28,104 |
|
|
15,761 |
|
|||||
|
Provision for (benefit from) income taxes |
931 |
|
|
(471) |
|
|
9,137 |
|
|
(1,101) |
|
|
10,554 |
|
|||||
|
Net income (loss) |
$ |
2,083 |
|
|
$ |
5,711 |
|
|
$ |
(2,071) |
|
|
$ |
29,205 |
|
|
$ |
5,207 |
|
|
Net income (loss) per common and common equivalent shares: |
|
|
|
|
|
|
|
|
|
||||||||||
|
Basic |
$ |
0.04 |
|
|
$ |
0.10 |
|
|
$ |
(0.04) |
|
|
$ |
0.52 |
|
|
$ |
0.10 |
|
|
Diluted |
$ |
0.03 |
|
|
$ |
0.10 |
|
|
$ |
(0.04) |
|
|
$ |
0.50 |
|
|
$ |
0.10 |
|
|
Weighted average number of common and common equivalent shares outstanding: |
|
|
|
|
|
|
|
|
|
||||||||||
|
Basic |
58,502 |
|
|
58,340 |
|
|
52,913 |
|
|
56,392 |
|
|
52,726 |
|
|||||
|
Diluted |
59,665 |
|
|
59,805 |
|
|
52,913 |
|
|
57,922 |
|
|
53,898 |
|
|||||
|
|
|
(1) Amounts for the three and twelve months ended December 31, 2017 have not been adjusted under the modified retrospective method of adoption of Topic 606, and are presented consistent with the prior period amounts reported under ASC 605. |
|
AXON ENTERPRISE, INC. |
|||||||||||||||||||||||||||||||||||
|
SEGMENT REPORTING |
|||||||||||||||||||||||||||||||||||
|
(Unaudited) |
|||||||||||||||||||||||||||||||||||
|
(dollars in thousands) |
|||||||||||||||||||||||||||||||||||
|
|
|||||||||||||||||||||||||||||||||||
|
|
Three Months Ended December 31, 2018 |
|
Three Months Ended September 30, 2018 |
|
Three Months Ended December 31, 2017 (1) |
||||||||||||||||||||||||||||||
|
|
TASER |
|
Software |
|
Total |
|
TASER |
|
Software |
|
Total |
|
TASER |
|
Software |
|
Total |
||||||||||||||||||
|
Net sales from products (2) |
$ |
65,301 |
|
|
$ |
23,716 |
|
|
$ |
89,017 |
|
|
$ |
63,666 |
|
|
$ |
17,257 |
|
|
$ |
80,923 |
|
|
$ |
64,409 |
|
|
$ |
13,099 |
|
|
$ |
77,508 |
|
|
Net sales from services (3) |
— |
|
|
25,774 |
|
|
25,774 |
|
|
— |
|
|
23,913 |
|
|
23,913 |
|
|
— |
|
|
17,143 |
|
|
17,143 |
|
|||||||||
|
Net sales |
65,301 |
|
|
49,490 |
|
|
114,791 |
|
|
63,666 |
|
|
41,170 |
|
|
104,836 |
|
|
64,409 |
|
|
30,242 |
|
|
94,651 |
|
|||||||||
|
Cost of product sales |
22,874 |
|
|
19,989 |
|
|
42,863 |
|
|
19,256 |
|
|
13,697 |
|
|
32,953 |
|
|
18,713 |
|
|
7,467 |
|
|
26,180 |
|
|||||||||
|
Cost of service sales |
— |
|
|
6,582 |
|
|
6,582 |
|
|
— |
|
|
6,250 |
|
|
6,250 |
|
|
— |
|
|
5,455 |
|
|
5,455 |
|
|||||||||
|
Cost of sales |
22,874 |
|
|
26,571 |
|
|
49,445 |
|
|
19,256 |
|
|
19,947 |
|
|
39,203 |
|
|
18,713 |
|
|
12,922 |
|
|
31,635 |
|
|||||||||
|
Gross margin |
42,427 |
|
|
22,919 |
|
|
65,346 |
|
|
44,410 |
|
|
21,223 |
|
|
65,633 |
|
|
45,696 |
|
|
17,320 |
|
|
63,016 |
|
|||||||||
|
Sales, general and administrative |
25,151 |
|
|
16,948 |
|
|
42,099 |
|
|
22,574 |
|
|
17,111 |
|
|
39,685 |
|
|
22,919 |
|
|
16,694 |
|
|
39,613 |
|
|||||||||
|
Research and development |
5,196 |
|
|
16,058 |
|
|
21,254 |
|
|
4,837 |
|
|
17,145 |
|
|
21,982 |
|
|
2,446 |
|
|
13,309 |
|
|
15,755 |
|
|||||||||
|
Income (loss) from operations |
$ |
12,080 |
|
|
$ |
(10,087) |
|
|
$ |
1,993 |
|
|
$ |
16,999 |
|
|
$ |
(13,033) |
|
|
$ |
3,966 |
|
|
$ |
20,331 |
|
|
$ |
(12,683) |
|
|
$ |
7,648 |
|
|
|
|
|
|
|
|
|
|
|
|
|
|
|
|
|
|
|
|
||||||||||||||||||
|
Gross margin % |
65.0 |
% |
|
46.3 |
% |
|
56.9 |
% |
|
69.8 |
% |
|
51.5 |
% |
|
62.6 |
% |
|
70.9 |
% |
|
57.3 |
% |
|
66.6 |
% |
|||||||||
|
Operating margin % |
18.5 |
% |
|
(20.4) |
% |
|
1.7 |
% |
|
26.7 |
% |
|
(31.7) |
% |
|
3.8 |
% |
|
31.6 |
% |
|
(41.9) |
% |
|
8.1 |
% |
|||||||||
|
|
Twelve Months Ended December 31, 2018 |
|
Twelve Months Ended December 31, 2017 (1) |
||||||||||||||||||||
|
|
TASER |
|
Software and |
|
Total |
|
TASER |
|
Software and |
|
Total |
||||||||||||
|
Net sales from products (2) |
$ |
253,115 |
|
|
$ |
74,520 |
|
|
$ |
327,635 |
|
|
$ |
234,512 |
|
|
$ |
51,347 |
|
|
$ |
285,859 |
|
|
Net sales from services (3) |
— |
|
|
92,433 |
|
|
92,433 |
|
|
— |
|
|
57,939 |
|
|
57,939 |
|
||||||
|
Net sales |
253,115 |
|
|
166,953 |
|
|
420,068 |
|
|
234,512 |
|
|
109,286 |
|
|
343,798 |
|
||||||
|
Cost of product sales |
80,354 |
|
|
58,983 |
|
|
139,337 |
|
|
72,054 |
|
|
45,943 |
|
|
117,997 |
|
||||||
|
Cost of service sales |
— |
|
|
22,148 |
|
|
22,148 |
|
|
— |
|
|
18,713 |
|
|
18,713 |
|
||||||
|
Cost of sales |
80,354 |
|
|
81,131 |
|
|
161,485 |
|
|
72,054 |
|
|
64,656 |
|
|
136,710 |
|
||||||
|
Gross margin |
172,761 |
|
|
85,822 |
|
|
258,583 |
|
|
162,458 |
|
|
44,630 |
|
|
207,088 |
|
||||||
|
Sales, general and administrative |
90,910 |
|
|
65,976 |
|
|
156,886 |
|
|
78,202 |
|
|
60,490 |
|
|
138,692 |
|
||||||
|
Research and development |
17,012 |
|
|
59,844 |
|
|
76,856 |
|
|
8,377 |
|
|
46,996 |
|
|
55,373 |
|
||||||
|
Income (loss) from operations |
$ |
64,839 |
|
|
$ |
(39,998) |
|
|
$ |
24,841 |
|
|
$ |
75,879 |
|
|
$ |
(62,856) |
|
|
$ |
13,023 |
|
|
|
|
|
|
|
|
|
|
|
|
|
|
||||||||||||
|
Gross margin % |
68.3 |
% |
|
51.4 |
% |
|
61.5 |
% |
|
69.3 |
% |
|
40.8 |
% |
|
60.2 |
% |
||||||
|
Operating margin % |
25.6 |
% |
|
(24.0) |
% |
|
5.9 |
% |
|
32.4 |
% |
|
(57.5) |
% |
|
3.8 |
% |
||||||
|
|
|
(1) Amounts for the three and twelve months ended December 31, 2017 have not been adjusted under the modified retrospective method of adoption of Topic 606, and are presented consistent with the prior period amounts reported under ASC 605. |
|
|
|
(2) Software and Sensors "products" revenue consists of sensors, including on-officer body cameras, Axon Fleet cameras, other hardware sensors, warranties on sensors, and other products, and is sometimes referred to as Sensors and Other revenue. |
|
|
|
(3) Software and Sensors "services" revenue comprises sales related to the Axon Cloud, which includes Axon Evidence, cloud-based evidence management software revenue, other recurring cloud-hosted software revenue and related professional services, and is sometimes referred to as Axon Cloud revenue. |
|
AXON ENTERPRISE, INC. |
|||||||||||||||||||||||
|
UNIT SALES STATISTICS |
|||||||||||||||||||||||
|
(Unaudited) |
|||||||||||||||||||||||
|
Units in whole numbers |
|||||||||||||||||||||||
|
|
|||||||||||||||||||||||
|
|
Three Months Ended December 31, |
|
Twelve Months Ended December 31, |
||||||||||||||||||||
|
|
2018 |
|
2017 |
|
Unit |
|
Percent |
|
2018 |
|
2017 |
|
Unit |
|
Percent |
||||||||
|
|
|
|
|
|
|
|
|
|
|
|
|
|
|
|
|
||||||||
|
TASER 7 |
5,759 |
|
|
— |
|
|
5,759 |
|
|
* |
|
|
5,759 |
|
|
— |
|
|
5,759 |
|
|
* |
|
|
TASER X26P |
18,597 |
|
|
23,350 |
|
|
(4,753) |
|
|
(20.4) |
|
|
71,823 |
|
|
70,381 |
|
|
1,442 |
|
|
2.0 |
|
|
TASER X2 |
13,088 |
|
|
21,683 |
|
|
(8,595) |
|
|
(39.6) |
|
|
65,855 |
|
|
76,106 |
|
|
(10,251) |
|
|
(13.5) |
|
|
TASER Pulse and Bolt |
7,490 |
|
|
3,641 |
|
|
3,849 |
|
|
105.7 |
|
|
18,398 |
|
|
12,504 |
|
|
5,894 |
|
|
47.1 |
|
|
Cartridges |
600,690 |
|
|
590,126 |
|
|
10,564 |
|
|
1.8 |
|
|
2,342,897 |
|
|
2,408,471 |
|
|
(65,574) |
|
|
(2.7) |
|
|
Axon Body |
26,167 |
|
|
13,944 |
|
|
12,223 |
|
|
87.7 |
|
|
85,965 |
|
|
89,808 |
|
|
(3,843) |
|
|
(4.3) |
|
|
Axon Flex |
5,080 |
|
|
5,253 |
|
|
(173) |
|
|
(3.3) |
|
|
15,541 |
|
|
26,025 |
|
|
(10,484) |
|
|
(40.3) |
|
|
Axon Fleet |
3,908 |
|
|
2,197 |
|
|
1,711 |
|
|
77.9 |
|
|
9,445 |
|
|
3,795 |
|
|
5,650 |
|
|
148.9 |
|
|
Axon Dock |
3,859 |
|
|
3,908 |
|
|
(49) |
|
|
(1.3) |
|
|
17,762 |
|
|
23,492 |
|
|
(5,730) |
|
|
(24.4) |
|
|
TASER Cam |
1,952 |
|
|
2,245 |
|
|
(293) |
|
|
(13.1) |
|
|
8,310 |
|
|
6,432 |
|
|
1,878 |
|
|
29.2 |
|
|
AXON ENTERPRISE, INC. |
|||||||||||||||||||
|
RECONCILIATION OF GAAP TO NON-GAAP FINANCIAL MEASURES |
|||||||||||||||||||
|
(Unaudited) |
|||||||||||||||||||
|
Dollars in thousands |
|||||||||||||||||||
|
|
|||||||||||||||||||
|
|
For the Three Months Ended |
|
For the Twelve Months Ended |
||||||||||||||||
|
|
December 31, |
|
September 30, |
|
December 31, |
|
December 31, |
|
December 31, |
||||||||||
|
EBITDA and Adjusted EBITDA: |
|
|
|
|
|
|
|
|
|
||||||||||
|
Net income (loss) |
$ |
2,083 |
|
|
$ |
5,711 |
|
|
$ |
(2,071) |
|
|
$ |
29,205 |
|
|
$ |
5,207 |
|
|
Depreciation and amortization |
2,389 |
|
|
3,065 |
|
|
2,364 |
|
|
10,615 |
|
|
8,041 |
|
|||||
|
Interest expense |
33 |
|
|
16 |
|
|
54 |
|
|
86 |
|
|
186 |
|
|||||
|
Investment interest income |
(1,076) |
|
|
(1,256) |
|
|
(227) |
|
|
(3,002) |
|
|
(904) |
|
|||||
|
Provision for (benefit from) income taxes |
931 |
|
|
(471) |
|
|
9,137 |
|
|
(1,101) |
|
|
10,554 |
|
|||||
|
EBITDA |
$ |
4,360 |
|
|
$ |
7,065 |
|
|
$ |
9,257 |
|
|
$ |
35,803 |
|
|
$ |
23,084 |
|
|
|
|
|
|
|
|
|
|
|
|
||||||||||
|
Adjustments: |
|
|
|
|
|
|
|
|
|
||||||||||
|
Stock-based compensation expense |
$ |
6,577 |
|
|
$ |
6,255 |
|
|
$ |
4,187 |
|
|
$ |
21,879 |
|
|
$ |
15,610 |
|
|
Transaction costs and adjustments related to business acquisition |
— |
|
|
— |
|
|
— |
|
|
1,382 |
|
|
290 |
|
|||||
|
Loss on disposal and abandonment of intangible assets |
14 |
|
|
2,049 |
|
|
1,146 |
|
|
2,117 |
|
|
1,146 |
|
|||||
|
Loss (gain) on disposal and impairment of property and equipment, net |
13 |
|
|
137 |
|
|
(28) |
|
|
303 |
|
|
(28) |
|
|||||
|
Adjusted EBITDA |
$ |
10,964 |
|
|
$ |
15,506 |
|
|
$ |
14,562 |
|
|
$ |
61,484 |
|
|
$ |
40,102 |
|
|
Net income (loss) as a percentage of net sales |
1.8 |
% |
|
5.4 |
% |
|
(2.2) |
% |
|
7.0 |
% |
|
1.5 |
% |
|||||
|
Adjusted EBITDA as a percentage of net sales |
9.6 |
% |
|
14.8 |
% |
|
15.4 |
% |
|
14.6 |
% |
|
11.7 |
% |
|||||
|
|
|
(1) Amounts for the three and twelve months ended December 31, 2017 have not been adjusted under the modified retrospective method of adoption of Topic 606, and are presented consistent with the prior period amounts reported under ASC 605. |
|
AXON ENTERPRISE, INC. |
|||||||||||||||||||
|
RECONCILIATION OF GAAP TO NON-GAAP FINANCIAL MEASURES - continued |
|||||||||||||||||||
|
(Unaudited) |
|||||||||||||||||||
|
Dollars in thousands |
|||||||||||||||||||
|
|
|||||||||||||||||||
|
|
For the Three Months Ended |
|
For the Twelve Months Ended |
||||||||||||||||
|
|
December 31, |
|
September 30, |
|
December 31, |
|
December 31, |
|
December 31, |
||||||||||
|
Non-GAAP net income: |
|
|
|
|
|
|
|
|
|
||||||||||
|
GAAP net income (loss) |
$ |
2,083 |
|
|
$ |
5,711 |
|
|
$ |
(2,071) |
|
|
$ |
29,205 |
|
|
$ |
5,207 |
|
|
Non-GAAP adjustments: |
|
|
|
|
|
|
|
|
|
||||||||||
|
Stock-based compensation expense |
6,577 |
|
|
6,255 |
|
|
4,187 |
|
|
21,879 |
|
|
15,610 |
|
|||||
|
Loss on disposal and abandonment of intangible assets |
14 |
|
|
2,049 |
|
|
1,146 |
|
|
2,117 |
|
|
1,146 |
|
|||||
|
Loss (gain) on disposal and impairment of property and equipment, net |
13 |
|
|
137 |
|
|
(28) |
|
|
303 |
|
|
(28) |
|
|||||
|
Transaction costs and adjustments related to business acquisition |
— |
|
|
— |
|
|
— |
|
|
1,382 |
|
|
290 |
|
|||||
|
One-time charge related to Tax Cuts and Jobs Act |
— |
|
|
— |
|
|
8,012 |
|
|
— |
|
|
8,012 |
|
|||||
|
Income tax effects |
(1,737) |
|
|
(2,048) |
|
|
(1,997) |
|
|
(6,366) |
|
|
(6,406) |
|
|||||
|
Income tax benefit of CEO stock option exercise |
(2,321) |
|
|
— |
|
|
— |
|
|
(5,683) |
|
|
— |
|
|||||
|
Non-GAAP net income |
$ |
4,629 |
|
|
$ |
12,104 |
|
|
$ |
9,249 |
|
|
$ |
42,837 |
|
|
$ |
23,831 |
|
|
|
|||||||||||||||||||
|
|
For the Three Months Ended |
|
For the Twelve Months Ended |
||||||||||||||||
|
|
December 31, |
|
September 30, |
|
December 31, |
|
December 31, |
|
December 31, |
||||||||||
|
Non-GAAP diluted earnings per share: |
|
|
|
|
|
|
|
|
|
||||||||||
|
GAAP diluted earnings per share |
$ |
0.03 |
|
|
$ |
0.10 |
|
|
$ |
(0.04) |
|
|
$ |
0.50 |
|
|
$ |
0.10 |
|
|
Non-GAAP adjustments: |
|
|
|
|
|
|
|
|
|
||||||||||
|
Stock-based compensation expense |
0.11 |
|
|
0.10 |
|
|
0.08 |
|
|
0.38 |
|
|
0.29 |
|
|||||
|
Loss on disposal and abandonment of intangible assets |
0.00 |
|
|
0.03 |
|
|
0.02 |
|
|
0.04 |
|
|
0.02 |
|
|||||
|
Loss (gain) on disposal and impairment of property and equipment, net |
0.00 |
|
|
0.00 |
|
|
(0.00) |
|
|
0.01 |
|
|
(0.00) |
|
|||||
|
Transaction costs and adjustments related to business acquisition |
— |
|
|
— |
|
|
— |
|
|
0.02 |
|
|
0.01 |
|
|||||
|
One-time charge related to Tax Cuts and Jobs Act |
— |
|
|
— |
|
|
0.15 |
|
|
— |
|
|
0.15 |
|
|||||
|
Income tax effects |
(0.03) |
|
|
(0.03) |
|
|
(0.04) |
|
|
(0.11) |
|
|
(0.12) |
|
|||||
|
Income tax benefit of CEO stock option exercise |
(0.04) |
|
|
— |
|
|
— |
|
|
(0.10) |
|
|
— |
|
|||||
|
Non-GAAP diluted earnings per share (2) |
$ |
0.08 |
|
|
$ |
0.20 |
|
|
$ |
0.17 |
|
|
$ |
0.74 |
|
|
$ |
0.44 |
|
|
|
|
|
|
|
|
|
|
|
|
||||||||||
|
Weighted average number of diluted common and common equivalent shares outstanding (in thousands) |
59,665 |
|
|
59,805 |
|
|
54,069 |
|
|
57,922 |
|
|
53,898 |
|
|||||
|
|
|
(1) Amounts for the three and twelve months ended December 31, 2017 have not been adjusted under the modified retrospective method of adoption of Topic 606, and are presented consistent with the prior period amounts reported under ASC 605. |
|
|
|
(2) The per share calculations for GAAP net income, Non-GAAP adjustments and Non-GAAP diluted earnings per share are each computed independently. Per share amounts may not sum due to rounding. |
|
AXON ENTERPRISE, INC. |
|||||||
|
CONSOLIDATED BALANCE SHEETS |
|||||||
|
(in thousands) |
|||||||
|
|
|||||||
|
|
December 31, 2018 |
|
December 31, 2017 |
||||
|
|
(Unaudited) |
|
|
||||
|
ASSETS |
|
|
|
|
|
|
|
|
Current Assets: |
|
|
|
||||
|
Cash and cash equivalents |
$ |
349,462 |
|
|
$ |
75,105 |
|
|
Short-term investments |
— |
|
|
6,862 |
|
||
|
Accounts and notes receivable, net |
130,579 |
|
|
56,064 |
|
||
|
Contract assets, net |
13,960 |
|
|
— |
|
||
|
Inventory, net |
33,763 |
|
|
45,465 |
|
||
|
Prepaid expenses and other current assets |
30,391 |
|
|
21,696 |
|
||
|
Total current assets |
558,155 |
|
|
205,192 |
|
||
|
|
|
|
|
||||
|
Property and equipment, net |
37,893 |
|
|
31,172 |
|
||
|
Deferred income tax assets, net |
19,347 |
|
|
15,755 |
|
||
|
Intangible assets, net |
15,935 |
|
|
18,823 |
|
||
|
Goodwill |
24,981 |
|
|
14,927 |
|
||
|
Long-term notes receivable, net of current portion |
40,230 |
|
|
36,877 |
|
||
|
Other assets |
22,999 |
|
|
15,366 |
|
||
|
Total assets |
$ |
719,540 |
|
|
$ |
338,112 |
|
|
|
|||||||
|
LIABILITIES AND STOCKHOLDERS' EQUITY |
|
|
|
|
|
|
|
|
Current Liabilities: |
|
|
|
||||
|
Accounts payable |
15,164 |
|
|
8,592 |
|
||
|
Accrued liabilities |
41,092 |
|
|
23,502 |
|
||
|
Current portion of deferred revenue |
107,016 |
|
|
70,401 |
|
||
|
Customer deposits |
2,702 |
|
|
3,673 |
|
||
|
Current portion of business acquisition contingent consideration |
— |
|
|
1,693 |
|
||
|
Other current liabilities |
37 |
|
|
89 |
|
||
|
Total current liabilities |
166,011 |
|
|
107,950 |
|
||
|
|
|
|
|
||||
|
Deferred revenue, net of current portion |
74,417 |
|
|
54,881 |
|
||
|
Liability for unrecognized tax benefits |
2,849 |
|
|
1,706 |
|
||
|
Long-term deferred compensation |
3,235 |
|
|
3,859 |
|
||
|
Business acquisition contingent consideration, net of current portion |
— |
|
|
1,048 |
|
||
|
Other long-term liabilities |
5,704 |
|
|
1,224 |
|
||
|
Total liabilities |
252,216 |
|
|
170,668 |
|
||
|
|
|
|
|
||||
|
Stockholders' Equity: |
|
|
|
||||
|
Preferred stock |
— |
|
|
— |
|
||
|
Common stock |
1 |
|
|
1 |
|
||
|
Additional paid-in capital |
453,400 |
|
|
201,672 |
|
||
|
Treasury stock |
(155,947) |
|
|
(155,947) |
|
||
|
Retained earnings |
171,383 |
|
|
123,185 |
|
||
|
Accumulated other comprehensive loss |
(1,513) |
|
|
(1,467) |
|
||
|
Total stockholders' equity |
467,324 |
|
|
167,444 |
|
||
|
Total liabilities and stockholders' equity |
$ |
719,540 |
|
|
$ |
338,112 |
|
|
AXON ENTERPRISE, INC. |
|||||||||||||||||||
|
SELECTED CASH FLOW INFORMATION |
|||||||||||||||||||
|
(Unaudited) |
|||||||||||||||||||
|
(in thousands) |
|||||||||||||||||||
|
|
|||||||||||||||||||
|
|
Three Months Ended |
|
Twelve Months Ended December 31, |
||||||||||||||||
|
|
December 31, |
|
September 30, |
|
December 31, |
|
2018 |
|
2017 (1) |
||||||||||
|
|
|
|
|
|
|
|
|
|
|
||||||||||
|
Net income (loss) |
$ |
2,083 |
|
|
$ |
5,711 |
|
|
$ |
(2,071) |
|
|
$ |
29,205 |
|
|
$ |
5,207 |
|
|
Depreciation and amortization |
2,389 |
|
|
3,065 |
|
|
2,364 |
|
|
10,615 |
|
|
8,041 |
|
|||||
|
Stock-based compensation |
6,577 |
|
|
6,255 |
|
|
4,187 |
|
|
21,879 |
|
|
15,610 |
|
|||||
|
Net cash provided by operating activities |
31,239 |
|
|
16,530 |
|
|
24,322 |
|
|
63,875 |
|
|
18,471 |
|
|||||
|
Net cash provided by (used in) investing activities |
(3,857) |
|
|
1,223 |
|
|
9,531 |
|
|
(9,860) |
|
|
19,082 |
|
|||||
|
Net cash provided by (used in) financing activities |
(2,810) |
|
|
(1,039) |
|
|
(2,245) |
|
|
219,348 |
|
|
(3,820) |
|
|||||
|
|
|
|
|
|
|
|
|
|
|
||||||||||
|
Cash and cash equivalents |
349,462 |
|
|
324,371 |
|
|
75,105 |
|
|
349,462 |
|
|
75,105 |
|
|||||
|
Restricted cash |
1,565 |
|
|
2,477 |
|
|
3,333 |
|
|
1,565 |
|
|
3,333 |
|
|||||
|
Cash, cash equivalents and restricted cash, end of period |
351,027 |
|
|
326,848 |
|
|
78,438 |
|
|
351,027 |
|
|
78,438 |
|
|||||
|
|
|||||||||||||||||||
|
|
Three Months Ended |
|
Twelve Months Ended December 31, |
||||||||||||||||
|
|
December 31, |
|
September 30, |
|
December 31, |
|
2018 |
|
2017 (1) |
||||||||||
|
|
|
|
|
|
|
|
|
|
|
||||||||||
|
Net cash provided by operating activities |
$ |
31,239 |
|
|
$ |
16,530 |
|
|
$ |
24,322 |
|
|
$ |
63,875 |
|
|
$ |
18,471 |
|
|
Purchases of property and equipment |
(4,259) |
|
|
(2,215) |
|
|
(1,347) |
|
|
(11,139) |
|
|
(10,419) |
|
|||||
|
Purchases of intangible assets |
(98) |
|
|
(206) |
|
|
(593) |
|
|
(558) |
|
|
(1,024) |
|
|||||
|
Cash flows related to business acquisitions |
— |
|
|
24 |
|
|
— |
|
|
(4,990) |
|
|
(10,629) |
|
|||||
|
Free cash flow (deficit), a non-GAAP measure |
$ |
26,882 |
|
|
$ |
14,133 |
|
|
$ |
22,382 |
|
|
$ |
47,188 |
|
|
$ |
(3,601) |
|
|
|
|
(1) Amounts for the three and twelve months ended December 31, 2017 have not been adjusted under the modified retrospective method of adoption of Topic 606, and are presented consistent with the prior period amounts reported under ASC 605. |
![]()
![]() View original content to download multimedia:http://www.prnewswire.com/news-releases/axon-delivers-record-q4-and-full-year-2018-revenue-and-bookings-introduces-2019-guidance-300802579.html
View original content to download multimedia:http://www.prnewswire.com/news-releases/axon-delivers-record-q4-and-full-year-2018-revenue-and-bookings-introduces-2019-guidance-300802579.html
SOURCE Axon