Press Releases


SCOTTSDALE, Ariz., May 9, 2019 /PRNewswire/ -- Axon (Nasdaq: AAXN), the global leader in public safety technology, today released the following quarterly update letter to shareholders.
- Record quarterly revenue of $116 million, up 14% year over year
- GAAP EPS of $0.11 and Non-GAAP EPS of $0.21
- Adjusted EBITDA of $14 million
- $329 million of cash and investments, and no debt at quarter end
- Raising full year revenue guidance to $485 million to $495 million

Dear Shareholders,
We view 2019 as pivotal for Axon and we are pleased to begin the year with strong momentum. This year, we bring to market Axon Body 3, our first camera with LTE live streaming, and launch Axon Records, our first stand-alone software product. It is also the year that we ramp production and sales of the TASER 7, which represents a complete product redesign, the result of seven years of research and development, and connects for the first time to our secure cloud via a dock, just like our body cameras.
We have substantial progress to report on our execution against these initiatives.
Axon Body 3 remains on track to begin shipping in Q3 2019. In April, we achieved a significant milestone — we successfully demonstrated live-streaming on both of our carrier partners, FirstNet, built with AT&T, and Verizon, and began the carrier certification process.
Axon Records is expected to go live with our launch customer, a major city(1) police department, later this year. We have successfully demonstrated that officers can write and review a variety of reports in our system, allowing us to finalize our statement of work with the agency. We are also starting a software pilot with a second major police department. Axon's entry into the records management software market will be groundbreaking because our leadership in body cameras allows us to make body camera video the heart of the incident record.
Finally, we have made steady improvements in our TASER 7 production yields. Q1 2019 TASER segment gross margins do not reflect the yield improvements because of our strategic decision to offer pro-rated trade-in credits based on the remaining useful life of customers' existing devices. We have been pleasantly surprised to see the level of interest in TASER 7 from customers with legacy weapons that are still relatively new. Migrating these customers to the TASER 7 program sooner allows us to capture a higher customer lifetime value, though it does cause ASP compression in the short term.
Total company gross margin is expected to expand throughout 2019 as we continue to improve TASER 7 yields and realize cost improvements on TASER 7 cartridge parts. Gross margin is also expected to benefit from natural trends in our business, including our growing software revenue mix, the amortization of TASER 7 live cartridge revenue, and the phasing out of TASER trade-in credits. We have conviction that TASER 7 is a game changer for law enforcement, and as we look ahead, we believe the gross profit profile on this program will be significant over the next several years.
Customer demand for our products and software continues to be robust. Last week, we hosted our fourth annual Accelerate conference, which has grown from 200 attendees to more than 1,800, becoming the leading technology conference for public safety professionals. The strength of our customer relationships and their excitement about new technologies under development was palpable.
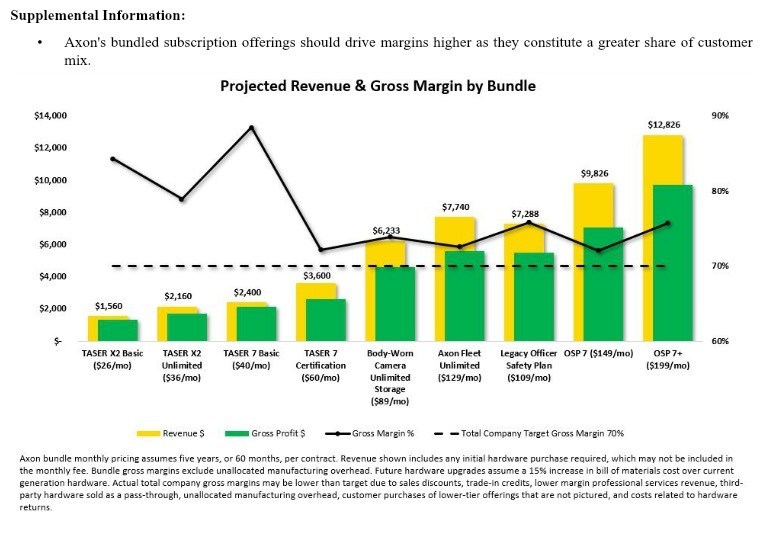
We are building a pipeline of dozens of multi-million dollar, multi-year contracts comprised of our highest value bundles. Importantly, we are seeing increased demand for our highest value TASER 7 contract bundle, which includes user training and unlimited duty cartridges. (See image: Revenue and gross margin by bundle.)
April was an important month for software development that supports our highest value bundles. Two product launches in particular should drive demand for OSP 7+ packages, and will allow us to recognize high margin software revenue.
First, we launched Axon Performance, analytical software that solves the need to ensure that body camera usage consistently complies with agency policy. Today, supervising officers undergo the arduous task of manually reviewing service call logs and comparing them to camera recording logs. Axon Performance automates this process in real time and reports metrics such as officers' body-worn camera activation rates and video categorization rates. Axon Performance also allows supervising officers to review random videos and provide documented feedback to ensure a robust oversight of their program.
Another product launch, Redaction Assistant, is our first advanced AI-powered tool. Solving the redaction challenges of body camera video is important for helping agencies comply with public disclosure laws while also respecting individuals' right to privacy. Compared with manual redaction, Redaction Assistant helps public information officers redact video in less than half the time - using AI assistance in blurring faces, license plates and screens - allowing footage to be shared with the public more quickly and with dramatically lower costs due to task automation.
Also in April, Axon achieved FedRAMP JAB authorization, clearing the way for federal government customers to use Axon Evidence (Evidence.com). Clearing this hurdle involved three years of site reliability engineering, architecture design and information security efforts. Axon Evidence is the first cloud-based digital evidence management system to achieve federal authorization, supporting our efforts to capture this expansive opportunity.
(1) The Major Cities Chiefs Association includes 69 of the largest urban areas in the United States and the 10 largest cities in Canada.
Summary of Q1 2019 Results
- Revenue of $116 million represents 14% year over year growth.
- Gross margin of 59.5% represents 260 basis points of sequential improvement, driven by strength in software and sensors, partially offset by TASER 7 program startup costs, including customer trade-in credits.
- Operating expenses of $66.2 million reflect continued R&D investment and SG&A expense discipline.
- SG&A of $42.9 million grew 2% sequentially.
- R&D of $23.4 million grew 10% sequentially on increases in headcount to support software product development.
- GAAP EPS of $0.11 includes a tax benefit related to the vesting of employee stock grants; Non-GAAP EPS of $0.21 excludes non-cash stock-based compensation expenses and also reflects the benefit of a favorable tax rate.
- Adjusted EBITDA of $14 million grew 27% or $3 million sequentially, primarily due to the rationalization of non-recurring expenses associated with Vievu, which we acquired in May 2018.
- Axon's strong balance sheet, which includes $329 million in cash and investments, and zero debt, provides us with the latitude to continue growing our subscription contracts as a percentage of revenue.
Financial commentary by segment
TASER
|
|
Three Months Ended |
|
Change |
||||||||||||||
|
|
March 31, 2019 |
|
December 31, |
|
March 31, 2018 |
|
QoQ |
|
YoY |
||||||||
|
TASER |
|
|
|
|
|
|
|
|
|
||||||||
|
Net sales |
$ |
65,391 |
|
|
$ |
65,301 |
|
|
$ |
63,524 |
|
|
0.1 |
% |
|
2.9 |
% |
|
Gross margin |
64.4 |
% |
|
65.0 |
% |
|
67.7 |
% |
|
-60bp |
|
-330bp |
|||||
- TASER revenue of $65.3 million, up 3% year over year, includes strength in legacy product pricing, strong UK sales and a 19% year over year increase in cartridge sales.
- The 8,800 TASER 7 units shipped in Q1 2019 represents unit volume on par with the entire first year of the TASER X2, which we introduced in 2011.
- TASER gross margin of 64.4% declined sequentially, largely driven by a dip in TASER 7 ASPs due to customer trade-in credits, combined with TASER 7 manufacturing yields that have not yet reached maturity. We also began depreciating TASER 7 production equipment for a full quarter. We expect TASER segment gross margins to strengthen in the back half.
- Approximately 42% of all weapons sold in Q1 were on a recurring payment plan. In the United States, recurring payment plans accounted for 51% of new TASER contracts, with TASER 7 contracts driving subscriptions.
Software & Sensors
|
|
Three Months Ended |
|
Change |
||||||||||||||
|
|
March 31, 2019 |
|
December 31, |
|
March 31, 2018 |
|
QoQ |
|
YoY |
||||||||
|
Software and Sensors |
|
|
|
|
|
|
|
|
|
||||||||
|
Axon Cloud net sales |
$ |
27,631 |
|
|
$ |
25,774 |
|
|
$ |
20,241 |
|
|
7.2 |
% |
|
36.5 |
% |
|
Axon Cloud gross margin |
73.6 |
% |
|
74.5 |
% |
|
78.7 |
% |
|
-90bp |
|
-510bp |
|||||
|
|
|
|
|
|
|
|
|
|
|
||||||||
|
Sensors and Other net sales |
$ |
22,788 |
|
|
$ |
23,716 |
|
|
$ |
17,450 |
|
|
(3.9) |
% |
|
30.6 |
% |
|
Sensors and Other gross margin |
28.4 |
% |
|
15.7 |
% |
|
31.9 |
% |
|
1,270bp |
|
-350bp |
|||||
- Axon Cloud revenue of $27.6 million grew 37% year over year.
- Axon Cloud gross margin of 73.6% was in line with our expectations.
- Sensors and Other revenue of $22.8 million grew 31% year over year and was down sequentially, reflecting typical seasonality and an anticipated slowdown of Axon Body 2 sales in advance of Axon Body 3 coming to market in Q3. We expect hardware revenue to strengthen in the back half of 2019 with the commencement of AB3 shipments.
- Sensors and Other gross margin of 28.4% was up substantially from 15.7% in Q4 2018, primarily due to the rationalization of one-time expenses associated with Vievu. As previously discussed, we manage to a 25% gross margin in sensors hardware, though it may vary quarter to quarter depending on mix.
Performance Figures
|
|
March 31, 2019 |
|
December 31, |
|
September 30, |
|
June 30, 2018 |
|
March 31, 2018 |
||||||||||
|
|
|
|
|
|
|
|
|
|
|
||||||||||
|
Annual recurring revenue (1) |
$ |
122,276 |
|
|
$ |
108,496 |
|
|
$ |
101,618 |
|
|
$ |
92,711 |
|
|
$ |
83,310 |
|
|
Cumulative Axon software seats booked |
371,100 |
|
|
347,200 |
|
|
325,200 |
|
|
305,200 |
|
|
226,900 |
|
|||||
|
Software and Sensors bookings |
$ |
76,391 |
|
|
$ |
109,779 |
|
|
$ |
92,895 |
|
|
$ |
88,860 |
|
|
$ |
97,528 |
|
|
Total company future contracted revenue |
$ |
930,000 |
|
|
$ |
900,000 |
|
|
$ |
820,000 |
|
|
$ |
750,000 |
|
|
$ |
650,000 |
|
|
|
|
(1) Monthly recurring license, integration, warranty, and storage revenue annualized. |
- Note that annual recurring revenue of $122 million is driven by only that portion of Axon's (371,100 cumulative) booked seats that are online and contributing to revenue. For the first time, annual recurring revenue includes software and warranty revenue related to TASER 7, which is our first true subscription-hardware TASER with software connectivity, a dock and cloud data storage. The strong sequential growth in ARR primarily reflects strength in domestic body camera and Axon Fleet software licenses. As we anticipated, the contribution from TASER 7 was minimal this quarter.
- For the first time, cumulative Axon booked seats includes TASER 7 software licenses.
- Software and Sensors bookings of $76 million reflect typical Q1 seasonality, which we did not experience in Q1 2018 due to a substantial international order. Excluding that single order one year ago, bookings grew on a year-over-year basis. We anticipate that bookings growth will strengthen after Axon Body 3 begins shipping in Q3 2019.
- Total company future contracted revenue of approximately $930 million is limited to revenue from arrangements that meet the definition of a contract under Topic 606 as of March 31, 2019. We expect to recognize between 15% to 20% of this balance over the next 12 months and expect the remainder to be recognized over the following five to seven years, subject to risks related to delayed deployments, budget appropriation or other contract cancellation clauses.
Outlook
For full year 2019, we are providing the following guidance:
- Raising revenue outlook to $485 million to $495 million, from $480 million to $490 million previously;
- We continue to expect to deliver significantly higher growth rates in the second half of 2019, driven by an anticipated acceleration of TASER 7 shipments and initial Axon Body 3 shipments.
- Q2 2019 revenue is expected to increase approximately 16% to 17% year over year;
- Maintaining Adjusted EBITDA guidance of $80 million to $85 million, which represents 34% year-over-year growth at the midpoint;
- Adjusted EBITDA in Q2 2019 is expected to be approximately flat sequentially and year over year.
- We expect stock-based compensation expenses to be approximately $35 million for the full year, which is subject to change depending on our assessment of the probability of attaining operational metrics for the CEO Performance Award and XSU awards, and the expected timing of such attainment; and
- A normalized tax rate of 20% to 25%, which can fluctuate depending on geography of income and the effects of discrete items, including changes in our stock price.
We are pleased with our year-to-date execution and look forward to updating you throughout the year.
Signed,
Rick Smith, CEO
Luke Larson, President
Jawad Ahsan, CFO
Quarterly conference call and Webcast
We will host our Q1 2019 earnings conference call on May 9 at 2 p.m. PT / 5 p.m. ET.
The call will be available via live audio webcast and archived replay on Axon's investor relations website at https://investor.axon.com.
Statistical Definitions
Software & Sensors bookings are an indication of the activity the Company is seeing relative to Software & Sensors hardware, software and Axon Evidence. We consider bookings to be a statistical measure defined as the sales price of orders (not invoiced sales), including contractual optional periods we expect to be exercised, net of cancellations, placed in the relevant fiscal period, regardless of when the products or services ultimately will be provided. Most bookings will be invoiced in subsequent periods.
Due to municipal government funding rules, in some cases certain of the future period amounts included in bookings are subject to budget appropriation or other contract cancellation clauses. Although Axon has entered into contracts for the delivery of products and services in the future and anticipates the contracts will be fulfilled, if agencies do not exercise contractual options, do not appropriate money in future year budgets or do enact a cancellation clause, revenue associated with these bookings may not ultimately be recognized, resulting in a future reduction to bookings.
For more information relative to our revenue recognition policies, please reference our SEC filings.
Non-GAAP Measures
To supplement the Company's financial results presented in accordance with GAAP, we present the non-GAAP financial measures of EBITDA, Adjusted EBITDA, Non-GAAP Net Income, Non-GAAP Diluted Earnings Per Share and Free Cash Flow. The Company's management uses these non-GAAP financial measures in evaluating the Company's performance in comparison to prior periods. We believe that both management and investors benefit from referring to these non-GAAP financial measures in assessing its performance, and when planning and forecasting our future periods. A reconciliation of GAAP to the non-GAAP financial measures is presented herein.
- EBITDA (Most comparable GAAP Measure: Net income) - Earnings before interest expense, investment interest income, income taxes, depreciation and amortization.
- Adjusted EBITDA (Most comparable GAAP Measure: Net income) - Earnings before interest expense, investment interest income, income taxes, depreciation, amortization, non-cash stock-based compensation expense and pre-tax certain other items (described below).
- Non-GAAP Net Income (Most comparable GAAP Measure: Net income) - Net income excluding the costs of non-cash stock-based compensation and excluding pre-tax certain other items, including, but not limited to, net gain/loss/write-down/disposal/abandonment of property, equipment and intangible assets; loss on impairment; and costs related to business acquisitions. The Company tax-effects non-GAAP adjustments using the blended statutory federal and state tax rates for each period presented.
- Non-GAAP Diluted Earnings Per Share (Most comparable GAAP Measure: Earnings Per share) - Measure of Company's Non-GAAP Net Income divided by the weighted average number of diluted common shares outstanding during the period presented.
- Free Cash Flow (Most comparable GAAP Measure: Cash flow from operating activities) - cash flows provided by operating activities minus purchases of property and equipment, intangible assets and cash flows related to business acquisitions.
Caution on Use of Non-GAAP Measures
Although these non-GAAP financial measures are not consistent with GAAP, management believes investors will benefit by referring to these non-GAAP financial measures when assessing the Company's operating results, as well as when forecasting and analyzing future periods. However, management recognizes that:
- these non-GAAP financial measures are limited in their usefulness and should be considered only as a supplement to the Company's GAAP financial measures;
- these non-GAAP financial measures should not be considered in isolation from, or as a substitute for, the Company's GAAP financial measures;
- these non-GAAP financial measures should not be considered to be superior to the Company's GAAP financial measures; and
- these non-GAAP financial measures were not prepared in accordance with GAAP and investors should not assume that the non-GAAP financial measures presented in this earnings release were prepared under a comprehensive set of rules or principles.
Further, these non-GAAP financial measures may be unique to the Company, as they may be different from similarly titled non-GAAP financial measures used by other companies. As such, this presentation of non-GAAP financial measures may not enhance the comparability of the Company's results to the results of other companies.
About Axon
Axon is a network of devices, apps, and people that helps public safety personnel become smarter and safer. With a mission of protecting life, our technologies give customers the confidence, focus and time they need to keep their communities safe. Our products impact every aspect of a public safety officer's day-to-day experience.
We work hard for those who put themselves in harm's way for all of us. To date, there are more than 371,100 software seats booked on the Axon network around the world and more than 216,000 lives and countless dollars have been saved with the Axon network of devices, apps and people. Learn more at www.axon.com or by calling (800) 978-2737.
AT&T is a trademark of AT&T Intellectual Property, Facebook is a trademark of Facebook, Inc., FirstNet is a trademark of the US Department of Commerce, Twitter is a trademark of Twitter, Inc., and Verizon is a trademark of Verizon Trademark Services LLC.
Axon, Axon Body 2, Axon Body 3, Axon Evidence, Axon Fleet, TASER, TASER 7, Vievu, X2, Protect Life and the Delta Logo are trademarks of Axon Enterprise, Inc., some of which are registered in the US and other countries. For more information, visit www.axon.com/legal. All rights reserved.
Follow Axon here:
- Axon on Twitter: https://twitter.com/axon_us
- Axon on Facebook: https://www.facebook.com/Axon.ProtectLife/
Forward-looking statements
These forward-looking statements include, without limitation, statements regarding: proposed products and services and related development efforts and activities; expectations about the market for our current and future products and services; expectations about customer behavior; statements concerning projections, predictions, expectations, estimates or forecasts as to our business, financial and operational results and future economic performance; and statements of management's strategies, goals and objectives and other similar expressions; as well as the ultimate resolution of financial statement items requiring critical accounting estimates, including those set forth in our Form 10-K for the year ended December 31, 2018. Such statements give our current expectations or forecasts of future events; they do not relate strictly to historical or current facts. Words such as "may," "will," "should," "could," "would," "predict," "potential," "continue," "expect," "anticipate," "future," "intend," "plan," "believe," "estimate," and similar expressions, as well as statements in future tense, identify forward-looking statements. However, not all forward-looking statements contain these identifying words.
We cannot guarantee that any forward-looking statement will be realized, although we believe we have been prudent in our plans and assumptions. Achievement of future results is subject to risks, uncertainties and potentially inaccurate assumptions. The following important factors could cause actual results to differ materially from those in the forward-looking statements: customer purchase behavior, including adoption of our software as a service delivery model; delayed cash collections and possible credit losses due to our subscription model; exposure to international operational risks; changes in the costs of product components and labor; defects in our products; the impact of product mix on projected gross margins; our ability to manage our supply chain and avoid production delays, shortages, and impacts to expected gross margins; our ability to design, introduce and sell new products or features; our ability to defend against litigation and protect our intellectual property, and the resulting costs of this activity; our exposure to cancellations of government contracts due to appropriation clauses, exercise of a cancellation clause, or non-exercise of contractually optional periods; loss of customer data, a breach of security or an extended outage, including our reliance on third party cloud-based storage providers; negative media publicity regarding our products; changes in government regulations in the U.S. and in foreign markets, especially related to the classification of our product by the United States Bureau of Alcohol, Tobacco, Firearms and Explosives and to evolving regulations surrounding privacy and data protection; our ability to integrate acquired businesses; our ability to attract and retain key personnel; and counter-party risks relating to cash balances held in excess of FDIC insurance limits. Many events beyond our control may determine whether results we anticipate will be achieved. Should known or unknown risks or uncertainties materialize, or should underlying assumptions prove inaccurate, actual results could differ materially from past results and those anticipated, estimated or projected. You should bear this in mind as you consider forward-looking statements. Our Annual Report on Form 10-K lists various important factors that could cause actual results to differ materially from expected and historical results. These factors are intended as cautionary statements for investors within the meaning of Section 21E of the Exchange Act and Section 27A of the Securities Act. Readers can find them under the heading "Risk Factors" in the Report on Form 10-K and in the Report on Form 10-Q, and investors should refer to them. You should understand that it is not possible to predict or identify all such factors. Consequently, you should not consider any such list to be a complete set of all potential risks or uncertainties.
Except as required by law, we undertake no obligation to publicly update forward-looking statements, whether as a result of new information, future events or otherwise. You are advised, however, to consult any further disclosures we make on related subjects in our Form 10-Q, 8-K and 10-K reports to the SEC.
Please visit https://investor.axon.com, https://www.axon.com/press, www.twitter.com/axon_us and https://www.facebook.com/Axon.ProtectLife/ where Axon discloses information about the company, its financial information, and its business.
For investor relations information please contact Andrea James via email at IR@axon.com.
CONTACT:
Investor Relations
Axon Enterprise, Inc.
IR@axon.com
|
AXON ENTERPRISE, INC. |
|||||||||||
|
UNAUDITED CONDENSED CONSOLIDATED STATEMENTS OF OPERATIONS |
|||||||||||
|
(in thousands, except per share data) |
|||||||||||
|
|
|||||||||||
|
|
Three Months Ended |
||||||||||
|
|
March 31, |
|
December 31, |
|
March 31, |
||||||
|
Net sales from products |
$ |
88,089 |
|
|
$ |
89,017 |
|
|
$ |
80,974 |
|
|
Net sales from services |
27,721 |
|
|
25,774 |
|
|
20,241 |
|
|||
|
Net sales |
115,810 |
|
|
114,791 |
|
|
101,215 |
|
|||
|
Cost of product sales |
39,600 |
|
|
42,863 |
|
|
32,434 |
|
|||
|
Cost of service sales |
7,293 |
|
|
6,582 |
|
|
4,320 |
|
|||
|
Cost of sales |
46,893 |
|
|
49,445 |
|
|
36,754 |
|
|||
|
Gross margin |
68,917 |
|
|
65,346 |
|
|
64,461 |
|
|||
|
Operating expenses: |
|
|
|
|
|
||||||
|
Sales, general and administrative |
42,892 |
|
|
42,099 |
|
|
35,759 |
|
|||
|
Research and development |
23,354 |
|
|
21,254 |
|
|
15,119 |
|
|||
|
Total operating expenses |
66,246 |
|
|
63,353 |
|
|
50,878 |
|
|||
|
Income from operations |
2,671 |
|
|
1,993 |
|
|
13,583 |
|
|||
|
Interest and other income, net |
2,313 |
|
|
1,021 |
|
|
1,263 |
|
|||
|
Income before provision for income taxes |
4,984 |
|
|
3,014 |
|
|
14,846 |
|
|||
|
Provision for (benefit from) income taxes |
(1,435) |
|
|
931 |
|
|
1,920 |
|
|||
|
Net income |
$ |
6,419 |
|
|
$ |
2,083 |
|
|
$ |
12,926 |
|
|
Net income per common and common equivalent shares: |
|
|
|
|
|
||||||
|
Basic |
$ |
0.11 |
|
|
$ |
0.04 |
|
|
$ |
0.24 |
|
|
Diluted |
$ |
0.11 |
|
|
$ |
0.03 |
|
|
$ |
0.24 |
|
|
Weighted average number of common and common equivalent shares outstanding: |
|
|
|
|
|
||||||
|
Basic |
58,914 |
|
|
58,502 |
|
|
53,119 |
|
|||
|
Diluted |
59,751 |
|
|
59,665 |
|
|
54,532 |
|
|||
|
AXON ENTERPRISE, INC. |
|||||||||||||||||||||||||||||||||||
|
SEGMENT REPORTING |
|||||||||||||||||||||||||||||||||||
|
(Unaudited) |
|||||||||||||||||||||||||||||||||||
|
(dollars in thousands) |
|||||||||||||||||||||||||||||||||||
|
|
|||||||||||||||||||||||||||||||||||
|
|
Three Months Ended March 31, 2019 |
|
Three Months Ended December 31, 2018 |
|
Three Months Ended March 31, 2018 |
||||||||||||||||||||||||||||||
|
|
TASER |
|
Software |
|
Total |
|
TASER |
|
Software |
|
Total |
|
TASER |
|
Software |
|
Total |
||||||||||||||||||
|
Net sales from products (1) |
$ |
65,301 |
|
|
$ |
22,788 |
|
|
$ |
88,089 |
|
|
$ |
65,301 |
|
|
$ |
23,716 |
|
|
$ |
89,017 |
|
|
$ |
63,524 |
|
|
$ |
17,450 |
|
|
$ |
80,974 |
|
|
Net sales from services (2) |
90 |
|
|
27,631 |
|
|
27,721 |
|
|
— |
|
|
25,774 |
|
|
25,774 |
|
|
— |
|
|
20,241 |
|
|
20,241 |
|
|||||||||
|
Net sales |
65,391 |
|
|
50,419 |
|
|
115,810 |
|
|
65,301 |
|
|
49,490 |
|
|
114,791 |
|
|
63,524 |
|
|
37,691 |
|
|
101,215 |
|
|||||||||
|
Cost of product sales |
23,278 |
|
|
16,322 |
|
|
39,600 |
|
|
22,874 |
|
|
19,989 |
|
|
42,863 |
|
|
20,543 |
|
|
11,891 |
|
|
32,434 |
|
|||||||||
|
Cost of service sales |
— |
|
|
7,293 |
|
|
7,293 |
|
|
— |
|
|
6,582 |
|
|
6,582 |
|
|
— |
|
|
4,320 |
|
|
4,320 |
|
|||||||||
|
Cost of sales |
23,278 |
|
|
23,615 |
|
|
46,893 |
|
|
22,874 |
|
|
26,571 |
|
|
49,445 |
|
|
20,543 |
|
|
16,211 |
|
|
36,754 |
|
|||||||||
|
Gross margin |
42,113 |
|
|
26,804 |
|
|
68,917 |
|
|
42,427 |
|
|
22,919 |
|
|
65,346 |
|
|
42,981 |
|
|
21,480 |
|
|
64,461 |
|
|||||||||
|
Gross margin % |
64.4 |
% |
|
53.2 |
% |
|
59.5 |
% |
|
65.0 |
% |
|
46.3 |
% |
|
56.9 |
% |
|
67.7 |
% |
|
57.0 |
% |
|
63.7 |
% |
|||||||||
|
|
|
|
|
|
|
|
|
|
|
|
|
|
|
|
|
|
|
||||||||||||||||||
|
Research and development |
3,712 |
|
|
19,642 |
|
|
23,354 |
|
|
5,196 |
|
|
16,058 |
|
|
21,254 |
|
|
2,960 |
|
|
12,159 |
|
|
15,119 |
|
|||||||||
|
|
|
(1) Software and Sensors "products" revenue consists of sensors, including on-officer body cameras, Axon Fleet cameras, other hardware sensors, warranties on sensors, and other products, and is sometimes referred to as Sensors and Other revenue. |
|
|
|
(2) Software and Sensors "services" revenue comprises sales related to the Axon Cloud, which includes Axon Evidence, cloud-based evidence management software revenue, other recurring cloud-hosted software revenue and related professional services, and is sometimes referred to as Axon Cloud revenue. TASER "services" revenue similarly includes amounts for Axon Evidence and related professional services. |
|
AXON ENTERPRISE, INC. |
|||||||||||
|
UNIT SALES STATISTICS |
|||||||||||
|
(Unaudited) |
|||||||||||
|
Units in whole numbers |
|||||||||||
|
|
|||||||||||
|
|
Three Months Ended March 31, |
||||||||||
|
|
2019 |
|
2018 |
|
Unit |
|
Percent |
||||
|
|
|
|
|
|
|
|
|
||||
|
TASER 7 |
8,835 |
|
|
— |
|
|
8,835 |
|
|
* |
|
|
TASER X26P |
14,985 |
|
|
15,720 |
|
|
(735) |
|
|
(4.7) |
|
|
TASER X2 |
9,861 |
|
|
20,501 |
|
|
(10,640) |
|
|
(51.9) |
|
|
TASER Pulse and Bolt |
1,253 |
|
|
4,000 |
|
|
(2,747) |
|
|
(68.7) |
|
|
Cartridges |
616,517 |
|
|
532,952 |
|
|
83,565 |
|
|
15.7 |
|
|
Axon Body |
25,848 |
|
|
21,769 |
|
|
4,079 |
|
|
18.7 |
|
|
Axon Flex |
3,591 |
|
|
3,693 |
|
|
(102) |
|
|
(2.8) |
|
|
Axon Fleet |
1,735 |
|
|
1,857 |
|
|
(122) |
|
|
(6.6) |
|
|
Axon Dock |
4,994 |
|
|
5,844 |
|
|
(850) |
|
|
(14.5) |
|
|
TASER Cam |
1,741 |
|
|
3,528 |
|
|
(1,787) |
|
|
(50.7) |
|
|
|
|
|
|
* Not meaningful |
|
AXON ENTERPRISE, INC. |
|||||||||||
|
RECONCILIATION OF GAAP TO NON-GAAP FINANCIAL MEASURES |
|||||||||||
|
(Unaudited) |
|||||||||||
|
Dollars in thousands |
|||||||||||
|
|
|||||||||||
|
|
Three Months Ended |
||||||||||
|
|
March 31, |
|
December 31, |
|
March 31, |
||||||
|
EBITDA and Adjusted EBITDA: |
|
|
|
|
|
||||||
|
Net income |
$ |
6,419 |
|
|
$ |
2,083 |
|
|
$ |
12,926 |
|
|
Depreciation and amortization |
2,800 |
|
|
2,389 |
|
|
2,411 |
|
|||
|
Interest expense |
6 |
|
|
33 |
|
|
20 |
|
|||
|
Investment interest income |
(2,003) |
|
|
(1,076) |
|
|
(75) |
|
|||
|
Provision for (benefit from) income taxes |
(1,435) |
|
|
931 |
|
|
1,920 |
|
|||
|
EBITDA |
$ |
5,787 |
|
|
$ |
4,360 |
|
|
$ |
17,202 |
|
|
|
|
|
|
|
|
||||||
|
Adjustments: |
|
|
|
|
|
||||||
|
Stock-based compensation expense |
$ |
7,905 |
|
|
$ |
6,577 |
|
|
$ |
4,093 |
|
|
Loss on disposal and abandonment of intangible assets |
18 |
|
|
14 |
|
|
— |
|
|||
|
Loss on disposal and impairment of property and equipment, net |
242 |
|
|
13 |
|
|
34 |
|
|||
|
Adjusted EBITDA |
$ |
13,952 |
|
|
$ |
10,964 |
|
|
$ |
21,329 |
|
|
Net income as a percentage of net sales |
5.5 |
% |
|
1.8 |
% |
|
12.8 |
% |
|||
|
Adjusted EBITDA as a percentage of net sales |
12.0 |
% |
|
9.6 |
% |
|
21.1 |
% |
|||
|
|
|
|
|
|
|
||||||
|
|
|
|
|
|
|
||||||
|
Stock-based compensation expense: |
|
|
|
|
|||||||
|
Cost of product and service sales |
$ |
226 |
|
|
$ |
152 |
|
|
$ |
141 |
|
|
Sales, general and administrative |
4,681 |
|
|
3,927 |
|
|
2,304 |
|
|||
|
Research and development |
2,998 |
|
|
2,498 |
|
|
1,648 |
|
|||
|
Total |
$ |
7,905 |
|
|
$ |
6,577 |
|
|
$ |
4,093 |
|
|
AXON ENTERPRISE, INC. |
|||||||||||
|
RECONCILIATION OF GAAP TO NON-GAAP FINANCIAL MEASURES - continued |
|||||||||||
|
(Unaudited) |
|||||||||||
|
Dollars in thousands |
|||||||||||
|
|
|||||||||||
|
|
Three Months Ended |
||||||||||
|
|
March 31, 2019 |
|
December 31, 2018 |
|
March 31, 2018 |
||||||
|
Non-GAAP net income: |
|
|
|
|
|
||||||
|
GAAP net income |
$ |
6,419 |
|
|
$ |
2,083 |
|
|
$ |
12,926 |
|
|
Non-GAAP adjustments: |
|
|
|
|
|
||||||
|
Stock-based compensation expense |
7,905 |
|
|
6,577 |
|
|
4,093 |
|
|||
|
Loss on disposal and abandonment of intangible assets |
18 |
|
|
14 |
|
|
— |
|
|||
|
Loss on disposal and impairment of property and equipment, net |
242 |
|
|
13 |
|
|
34 |
|
|||
|
Income tax effects |
(2,016) |
|
|
(1,737) |
|
|
(1,002) |
|
|||
|
Income tax benefit of CEO stock option exercise |
— |
|
|
(2,321) |
|
|
— |
|
|||
|
Non-GAAP net income |
$ |
12,568 |
|
|
$ |
4,629 |
|
|
$ |
16,051 |
|
|
|
|||||||||||
|
|
Three Months Ended |
||||||||||
|
|
March 31, 2019 |
|
December 31, 2018 |
|
March 31, 2018 |
||||||
|
Non-GAAP diluted earnings per share: |
|
|
|
|
|
||||||
|
GAAP diluted earnings per share |
$ |
0.11 |
|
|
$ |
0.03 |
|
|
$ |
0.24 |
|
|
Non-GAAP adjustments: |
|
|
|
|
|
||||||
|
Stock-based compensation expense |
0.13 |
|
|
0.11 |
|
|
0.08 |
|
|||
|
Loss on disposal and abandonment of intangible assets |
0.00 |
|
|
— |
|
|
— |
|
|||
|
Loss on disposal and impairment of property and equipment, net |
0.00 |
|
|
0.00 |
|
|
— |
|
|||
|
Income tax effects |
(0.03) |
|
|
(0.03) |
|
|
(0.02) |
|
|||
|
Income tax benefit of CEO stock option exercise |
— |
|
|
(0.04) |
|
|
— |
|
|||
|
Non-GAAP diluted earnings per share (1) |
$ |
0.21 |
|
|
$ |
0.08 |
|
|
$ |
0.29 |
|
|
|
|
|
|
|
|
||||||
|
Weighted average number of diluted common and common equivalent shares outstanding (in thousands) |
59,751 |
|
|
59,665 |
|
|
54,532 |
|
|||
|
|
|
(1) The per share calculations for GAAP net income, Non-GAAP adjustments and Non-GAAP diluted earnings per share are each computed independently. Per share amounts may not sum due to rounding. |
|
AXON ENTERPRISE, INC. |
|||||||
|
CONDENSED CONSOLIDATED BALANCE SHEETS |
|||||||
|
(in thousands) |
|||||||
|
|
|||||||
|
|
March 31, 2019 |
|
December 31, 2018 |
||||
|
|
(Unaudited) |
|
|
||||
|
ASSETS |
|||||||
|
Current Assets: |
|
|
|
||||
|
Cash and cash equivalents |
$ |
223,642 |
|
|
$ |
349,462 |
|
|
Short-term investments |
105,312 |
|
|
— |
|
||
|
Accounts and notes receivable, net |
149,096 |
|
|
130,579 |
|
||
|
Contract assets, net |
17,945 |
|
|
13,960 |
|
||
|
Inventory |
37,587 |
|
|
33,763 |
|
||
|
Prepaid expenses and other current assets |
33,340 |
|
|
30,391 |
|
||
|
Total current assets |
566,922 |
|
|
558,155 |
|
||
|
|
|
|
|
||||
|
Property and equipment, net |
41,347 |
|
|
37,893 |
|
||
|
Deferred income tax assets, net |
18,770 |
|
|
19,347 |
|
||
|
Intangible assets, net |
15,067 |
|
|
15,935 |
|
||
|
Goodwill |
25,017 |
|
|
24,981 |
|
||
|
Long-term notes receivable, net of current portion |
36,316 |
|
|
40,230 |
|
||
|
Other assets |
35,756 |
|
|
22,999 |
|
||
|
Total assets |
$ |
739,195 |
|
|
$ |
719,540 |
|
|
|
|
|
|
||||
|
LIABILITIES AND STOCKHOLDERS' EQUITY |
|||||||
|
Current Liabilities: |
|
|
|
||||
|
Accounts payable |
$ |
9,865 |
|
|
$ |
15,164 |
|
|
Accrued liabilities |
36,348 |
|
|
41,092 |
|
||
|
Current portion of deferred revenue |
110,063 |
|
|
107,016 |
|
||
|
Customer deposits |
3,604 |
|
|
2,702 |
|
||
|
Other current liabilities |
3,914 |
|
|
37 |
|
||
|
Total current liabilities |
163,794 |
|
|
166,011 |
|
||
|
|
|
|
|
||||
|
Deferred revenue, net of current portion |
74,784 |
|
|
74,417 |
|
||
|
Liability for unrecognized tax benefits |
3,156 |
|
|
2,849 |
|
||
|
Long-term deferred compensation |
3,675 |
|
|
3,235 |
|
||
|
Other long-term liabilities |
13,247 |
|
|
5,704 |
|
||
|
Total liabilities |
258,656 |
|
|
252,216 |
|
||
|
|
|
|
|
||||
|
Stockholders' Equity: |
|
|
|
||||
|
Preferred stock |
— |
|
|
— |
|
||
|
Common stock |
1 |
|
|
1 |
|
||
|
Additional paid-in capital |
460,146 |
|
|
453,400 |
|
||
|
Treasury stock |
(155,947) |
|
|
(155,947) |
|
||
|
Retained earnings |
177,802 |
|
|
171,383 |
|
||
|
Accumulated other comprehensive loss |
(1,463) |
|
|
(1,513) |
|
||
|
Total stockholders' equity |
480,539 |
|
|
467,324 |
|
||
|
Total liabilities and stockholders' equity |
$ |
739,195 |
|
|
$ |
719,540 |
|
|
AXON ENTERPRISE, INC. |
|||||||||||
|
UNAUDITED CONDENSED CONSOLIDATED STATEMENTS OF CASH FLOWS |
|||||||||||
|
(in thousands) |
|||||||||||
|
|
|||||||||||
|
|
Three Months Ended |
||||||||||
|
|
March 31, |
|
December 31, |
|
March 31, |
||||||
|
Cash flows from operating activities: |
|
|
|
|
|
||||||
|
Net income |
$ |
6,419 |
|
|
$ |
2,083 |
|
|
$ |
12,926 |
|
|
Adjustments to reconcile net income to net cash provided by operating activities: |
|
|
|
|
|
||||||
|
Depreciation and amortization |
2,800 |
|
|
2,389 |
|
|
2,411 |
|
|||
|
Loss on disposal and abandonment of intangible assets |
18 |
|
|
1,827 |
|
|
— |
|
|||
|
Loss (gain) on disposal and impairment of property and equipment, net |
242 |
|
|
(1,800) |
|
|
34 |
|
|||
|
Stock-based compensation |
7,905 |
|
|
6,577 |
|
|
4,093 |
|
|||
|
Deferred income taxes |
577 |
|
|
(1,266) |
|
|
1,514 |
|
|||
|
Unrecognized tax benefits |
307 |
|
|
1,045 |
|
|
104 |
|
|||
|
Other noncash, net |
896 |
|
|
— |
|
|
22 |
|
|||
|
Change in assets and liabilities: |
|
|
|
|
|
||||||
|
Accounts and notes receivable |
(21,994) |
|
|
(16,471) |
|
|
(17,060) |
|
|||
|
Inventory |
(3,936) |
|
|
5,771 |
|
|
2,408 |
|
|||
|
Prepaid expenses and other assets |
(3,152) |
|
|
(658) |
|
|
(1,702) |
|
|||
|
Accounts payable, accrued liabilities and other liabilities |
(7,284) |
|
|
9,200 |
|
|
6,740 |
|
|||
|
Deferred revenue |
3,232 |
|
|
22,542 |
|
|
6,554 |
|
|||
|
Net cash provided by (used in) operating activities |
(13,970) |
|
|
31,239 |
|
|
18,044 |
|
|||
|
Cash flows from investing activities: |
|
|
|
|
|
||||||
|
Purchases of investments |
(105,322) |
|
|
— |
|
|
(802) |
|
|||
|
Proceeds from call / maturity of investments |
— |
|
|
500 |
|
|
3,167 |
|
|||
|
Purchases of property and equipment |
(5,271) |
|
|
(4,259) |
|
|
(1,063) |
|
|||
|
Purchases of intangible assets |
(162) |
|
|
(98) |
|
|
(34) |
|
|||
|
Net cash provided by (used in) investing activities |
(110,755) |
|
|
(3,857) |
|
|
1,268 |
|
|||
|
Cash flows from financing activities: |
|
|
|
|
|
||||||
|
Proceeds from options exercised |
100 |
|
|
1,044 |
|
|
356 |
|
|||
|
Income and payroll tax payments for net-settled stock awards |
(1,259) |
|
|
(2,154) |
|
|
(3,777) |
|
|||
|
Payment of contingent consideration for business acquisitions |
— |
|
|
(1,700) |
|
|
— |
|
|||
|
Net cash used in financing activities |
(1,159) |
|
|
(2,810) |
|
|
(3,421) |
|
|||
|
Effect of exchange rate changes on cash and cash equivalents |
67 |
|
|
(393) |
|
|
469 |
|
|||
|
Net increase (decrease) in cash and cash equivalents |
(125,817) |
|
|
24,179 |
|
|
16,360 |
|
|||
|
Cash and cash equivalents, beginning of period |
351,027 |
|
|
326,848 |
|
|
78,438 |
|
|||
|
Cash and cash equivalents, end of period |
$ |
225,210 |
|
|
$ |
351,027 |
|
|
$ |
94,798 |
|
|
AXON ENTERPRISE, INC. |
|||||||||||
|
SUPPLEMENTAL CASH FLOW INFORMATION |
|||||||||||
|
(Unaudited) |
|||||||||||
|
(in thousands) |
|||||||||||
|
|
|||||||||||
|
|
Three Months Ended |
||||||||||
|
|
March 31, 2019 |
|
December 31, |
|
March 31, 2018 |
||||||
|
|
|
|
|
|
|
||||||
|
Cash and cash equivalents |
$ |
223,642 |
|
|
$ |
349,462 |
|
|
$ |
92,330 |
|
|
Restricted cash |
1,568 |
|
|
1,565 |
|
|
2,468 |
|
|||
|
Cash, cash equivalents and restricted cash, end of period |
$ |
225,210 |
|
|
$ |
351,027 |
|
|
$ |
94,798 |
|
|
|
|||||||||||
|
|
Three Months Ended |
||||||||||
|
|
March 31, 2019 |
|
December 31, |
|
March 31, 2018 |
||||||
|
|
|
|
|
|
|
||||||
|
Net cash provided by (used in) operating activities |
$ |
(13,970) |
|
|
$ |
31,239 |
|
|
$ |
18,044 |
|
|
Purchases of property and equipment |
(5,271) |
|
|
(4,259) |
|
|
(1,063) |
|
|||
|
Purchases of intangible assets |
(162) |
|
|
(98) |
|
|
(34) |
|
|||
|
Free cash flow (deficit), a non-GAAP measure |
$ |
(19,403) |
|
|
$ |
26,882 |
|
|
$ |
16,947 |
|
![]()
![]() View original content to download multimedia:http://www.prnewswire.com/news-releases/axon-reports-record-q1-2019-revenue-raises-full-year-revenue-guidance-reiterates-timeline-for-new-product-launches-300847433.html
View original content to download multimedia:http://www.prnewswire.com/news-releases/axon-reports-record-q1-2019-revenue-raises-full-year-revenue-guidance-reiterates-timeline-for-new-product-launches-300847433.html
SOURCE Axon