Press Releases


SCOTTSDALE, Ariz., Nov. 15, 2021 /PRNewswire/ --
Dear Shareholders,
Throughout the year, as evidenced by our strong results and strengthening outlook, we have continued to execute on our stated objectives to:
- Grow our core through innovation in our key products,
- Scale new products by developing solutions to real-world challenges,
- Unlock new areas for growth by extending our reach to new markets, and
- Drive operating efficiencies across our manufacturing, hiring and support systems.
The third quarter was no exception. Our teams delivered strong performance across the board, driving revenue growth of 39% to $232 million, and GAAP net income of $49 million, which supported Adjusted EBITDA of $51 million, representing a 22% margin. Net income was favorably impacted by a $51 million tax benefit. Our SaaS performance was equally strong, with annual recurring revenue growing 42% to $289 million, supported by deployments in the federal market and international regions. Record Q3 bookings of $488 million were up 54%, driven by strength in software and sensors, bringing year-to-date bookings to nearly $1.2 billion, above full year 2020 levels.
Axon's expanding growth story
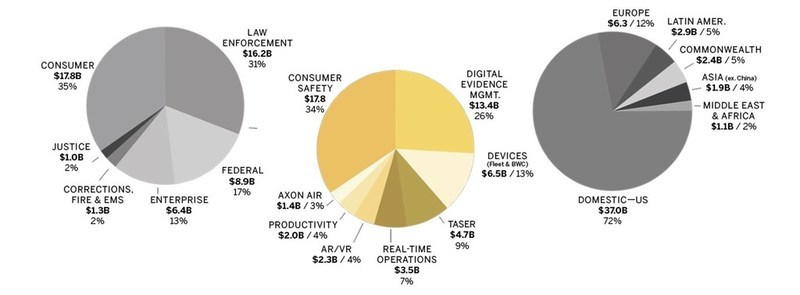
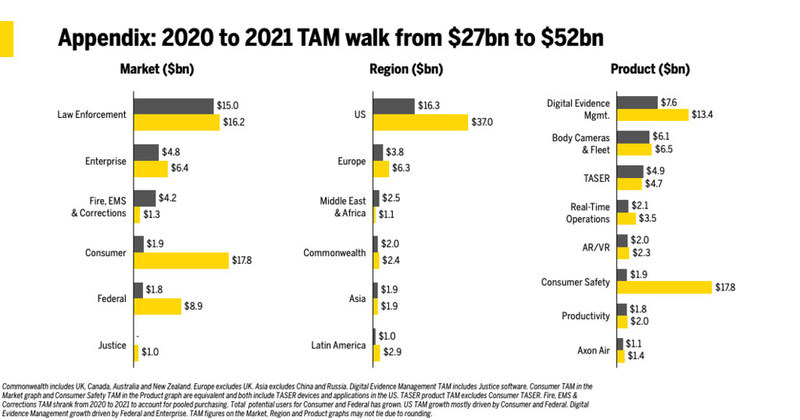
As we look ahead to our long-range plans, we are providing an update on our growth story, raising our estimated total addressable market, or TAM, from $27 billion to $52 billion, and sharing our analysis on penetration by region and product category.
TAM growing through investments in products, markets and regions:
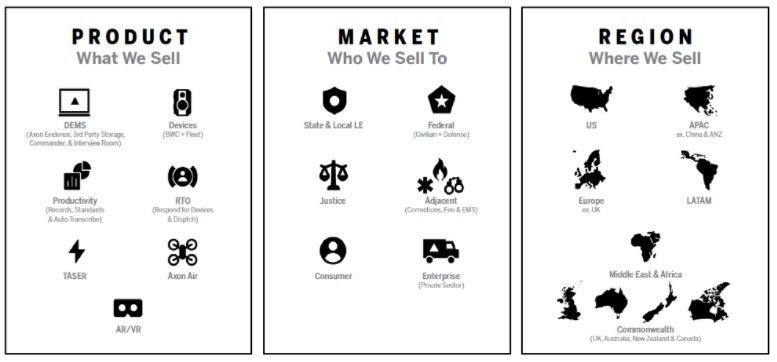
Our investments for scale are expanding our total addressable market along three axes — introducing new products, selling into new customer market segments, and adding sales channels to new geographic regions. Our updated estimate points to a $52 billion total addressable market(1).


Two of our newest drivers of TAM growth include our investments in consumer safety and justice software.
Consumer: We see opportunity to create more effective and reliable personal protection for private individuals, and, thus, our consumer business is a growing area of investment. When we say TASER is less than 25% penetrated in the US and even lower globally, that statistic refers to professional users and does not include individual consumers. Our current market penetration in consumer is virtually nil. Historically, our law enforcement and consumer devices have relied upon separate platforms. To drive greater efficiency and reliability, our next generation consumer and law enforcement devices will leverage much of the same core technology. We also plan to offer personal safety solutions, including a consumer-focused smartphone app, and expect to share more details over the coming quarters.
Justice: Axon's expansion into justice software is a natural evolution of our market-leading cloud-hosted digital evidence management software category. Specifically, we are developing software to help prosecutors and defense attorneys streamline the discovery process. Not only is our goal to save attorneys time, but also to shorten the time people are jailed awaiting trial. We are enthusiastic about the opportunities in this category and will be sharing more in the coming months around product launch and customers.
TAM penetration analysis showcases runway for growth:
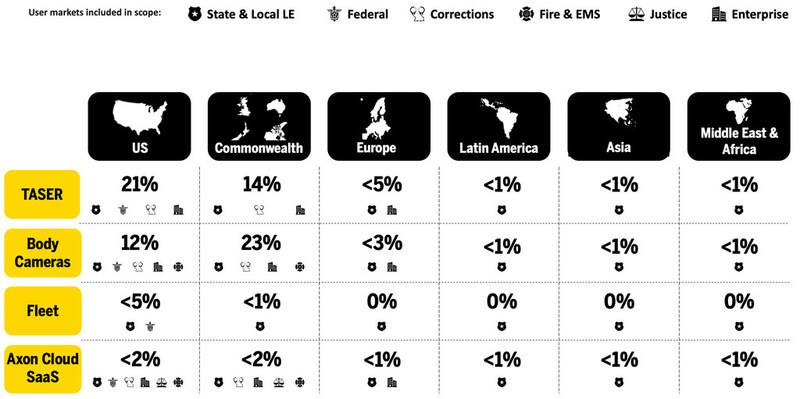
We see ourselves as less than 2% penetrated across our addressable markets, based on an analysis of potential user penetration in devices and potential dollar penetration in software.
The user penetration for our cloud-connected devices and dollar penetration in software showcases our opportunity for growth across products and regions. Importantly, our TAM penetration analysis(2) excludes select market segments from certain geographies where we are not selling today, highlighting the opportunity to continue to expand our TAM and add incremental growth drivers.

(1) | Our TAM methodology estimates annual potential spending on Axon products by considering total possible users in regions and markets we are selling into, based on publicly available user data by job category from U.S. Bureau of Labor Statistics and other public sources, or Axon intends to sell into in the near term, as well as current annual subscription pricing for existing products and estimated annual pricing for future products, based on an analysis of market-supported pricing. Note that with Axon's integrated bundles, under ASC 606, product (hardware) revenue is recognized upon shipment to the customer and service (software) revenue is recognized over time as a time-based obligation to the customer. The TAM, as presented, shows potential annual subscription spending, which will equal revenue recognized over the life of a multi-year contract, but spending and revenue do not always match up in the same year due to the timing difference between subscription-based payments and revenue recognition. |
(2) | Our TAM penetration methodology factors in Axon's internal estimates for unit sales to date and software revenue to date, as well as potential users based on publicly available data. Commonwealth includes UK, Canada, Australia and New Zealand. Europe excludes UK. Asia excludes China and Russia. TASER, body camera and Axon Fleet percentages represent user penetration, while Axon Cloud SaaS represents dollar penetration. Consumer TASER not included within TASER TAM penetration. Consumer TASER penetration is less than 1% in the US. Axon Cloud SaaS includes Digital Evidence Management, Productivity and Real-Time Operations. Axon Air & AR/VR are not shown given estimated TAM penetrations of about 0%. |
Select Q3 highlights
- Driving customer engagement and excitement:
- Accelerate user conference returns to in-person: Axon hosted nearly 1,500 attendees at its sixth annual user conference in Phoenix during the first week of November, drawing many of the best and brightest public safety leaders from around the globe. One of the world's largest public safety technology conferences, Axon Accelerate provides a forum to inform and empower our customers, and this year we discussed both the opportunities and challenges presented by today's rapidly changing world. We were pleased to be joined by representatives and exhibitors from our rapidly growing ecosystem of technology partners, including Cellebrite, Skydio and Cradlepoint. Whether it's AI, VR or 5G, when it comes to transformative technologies, we're always discovering and investing in ways to help our customers work smarter
- Voyager Roadshow success: Axon is hosting a customer-focused roadshow from June through December, which started with the Los Angeles Police Department. Three custom Axon Voyager trailers will visit the 48 contiguous United States to provide demonstrations of our latest technology. Each Axon Voyager trailer comes with a Cradlepoint and Verizon-powered control room for software demos, two VR training bays that allow officers to try Axon's latest community engagement training modules, and a TASER 7 firing range, where officers can receive hands-on practice with Axon's latest generation of TASER device, guided by a TASER Master Instructor.
- New software products accelerating traction: New product bookings more than doubled through the end of the third quarter, led by software services, including Axon Records, Axon Respond, AI-enabled transcription, and AI-enabled automated license plate reading (ALPR).
- Demand for Virtual Reality training exceeds expectations: Our Virtual Reality training offers a transformational alternative to tactical training, delivering compelling immersive content and pairing that with our robust training platform, including Axon Academy curriculum. VR training powered by AI will fundamentally transform our ability to level up skills in the field — and we can also use it beyond training to build physical capabilities. VR is the fastest growing new product we've ever launched(3).
- International strength across product lines:
- Standalone software: Both the Province of British Columbia, through PRIMECorp, as well as the Scottish Government selected Axon's SaaS-based digital evidence management solution, Axon Evidence, to fulfill groundbreaking modernization initiatives. Both projects are cornerstones in connecting justice sector partners and stakeholders, including the police, courts, prosecutors and defense agents, and are notable for being standalone digital evidence management deals. Axon was selected through an open and competitive procurement process in both scenarios. The partnership with PRIMECorp represents Axon's largest standalone software deal ever.
"Our goal was to evaluate the market for a partner that can help bring the benefits of modernizing our digital evidence management from collection, storing and sharing with our justice partners, so we can be more effective. After an extensive evaluation that spanned two-years involving a formal procurement process that included an operational pilot with multiple agencies, PRIMECorp is confident in Axon Evidence as a common platform amongst the BC Police Agencies now and into the future." — Wayne Plamondon, PRIMECorp, Chief Operating Officer
"This is an important step in improving the experience of victims and witnesses in the criminal justice process. The Digital Evidence Sharing Capability programme will make a real difference to the time taken for cases to come to court, allowing those involved in criminal cases to move on with their lives sooner. Reducing delays is just one of the benefits this programme will bring. We are also putting in place a modern, forward-looking platform that can be used to help develop future transformation in the criminal justice system." — Scottish Justice Secretary Keith Brown
(3) | Based upon comparing bookings trajectory following launch. |
- Cloud-connected TASER devices: The Toronto Police Service is expanding its TASER 7 program across the city to every officer in the field.
"We continue to see the positive impact within our communities by outfitting officers with [TASER devices.] With this expansion project, our officers will no longer need to share devices but all officers in the field will be outfitted with the advanced capabilities of the Axon TASER 7. This will help us be more efficient in reporting and more accountable to our citizens." —Toronto Police Service Chief James Ramer - Body-worn cameras and real-time awareness: The Gujarat State Police is equipping officers throughout Gujarat, India with more than 10,000 body-worn cameras. The service will also deploy a portion of the cameras with Axon's real-time situational awareness software, Respond, which gives supervisors access to location-mapping and live streaming, providing visibility into evolving situations to inform decisions about resourcing and back-up. This growing partnership reflects Axon's strategy to land and expand within regions. In early 2020, Gujarat State Police became the first major police agency in India to deploy TASER devices
"With the introduction of body-worn cameras and a digital evidence management solution, we will significantly enhance our policing capability across the state of Gujarat." — Mr. Narasimha Komar IPS, Additional Director General of Police (Planning & Modernization) Gujarat State Police - Domestic bundling strength drives annual recurring revenue and net dollar retention: Our customers are increasingly adopting a broad suite of Axon's solutions at once, which is driving increased order size and strong performance across our SaaS metrics. Recent examples include:
- The Oklahoma City Police Department signed a five-year Officer Safety Plan 7+ Premium bundle in September to deploy TASER 7 devices, Axon Body 3 cameras with real-time situational software, Axon Respond and Axon Records. The Major Cities Chiefs Association member will also be implementing the next generation Axon Fleet 3 in-car video system with ALPR technology and Axon Air licenses.
- The Virginia Beach Police Department, a Major Cities Chiefs Association member, signed a ten-year contract on the Officer Safety Plan 7+ Premium bundle, in July, and is adopting Axon Records.
- The Grand Prairie Police Department in Texas signed a contract in August for 260 Officer Safety Plan 7+ Premium licenses, 210 Axon Fleet 3 in-car cameras, and is adopting Axon Records and Axon Dispatch.
- The Metropolitan Transportation Authority Police Department in New York, in September, signed 1,000 Officer Safety Plan 7+ Premium licenses with Axon Auto-Transcribe, which drives efficiency by transcribing body camera video.
- The Louisville Metro Police Department in Kentucky adopted 1,200 Officer Safety Plan 7+ licenses in September.
- The Minnesota State Patrol signed 700 Officer Safety Plan 7+ Premium, Axon Respond, Axon Auto-Tagging, Axon Performance and 700 Axon Fleet 3 in-car cameras in September.
- The Santa Fe Police Department signed 193 Officer Safety Plan 7+ Premium, 240 Fleet 3 in-car cameras, and four Axon Interview licenses in August.
- The Salt Lake City Police Department signed 550 licenses for an Officer Safety Plan 7+ Premium upgrade in September.
- The Pima County Sheriff's Office in Arizona signed 700 Officer Safety Plan 7+ Premium, Axon Auto-Transcribe, Axon Records, Axon Respond and Unlimited 7 Licensing in September.
- The Sacramento Police Department signed 700 Officer Safety Plan 7+, 245 Unlimited 7 Licensing and 50 Axon Air licenses in September.
Environmental, Social & Governance (ESG) Updates:
- Community engagement gets a boost with My90 acquisition:
- In August, Axon acquired(4) My90 Inc., which collects anonymized community feedback to generate actionable insights that help police agencies improve trust, safety and equity. Kona Shen and Mustafa Abdul-Hamid founded My90 in 2016 to give communities a secure line of feedback to public safety agencies that could foster community trust and understanding. Since 2016, My90 expanded its services to help individual officers deliver anonymous feedback to department leadership. My90 maintains privacy and anonymity when displaying results via interactive dashboards, which will be available on the Axon Network
"We created this tool as a way for members of the public to safely give feedback about their interactions with law enforcement officers. Using data and anonymous feedback, agencies can see the impact they are having within their communities, community members can provide valuable input, and agencies can set goals and track progress over time." — Kona Shen, former CEO of My90, who joined Axon as VP and General Manager. - The acquisition builds upon Axon's efforts launched in 2020 to form a Community Impact team comprised of industry experts at the intersection of civil rights, law enforcement, education, mental health and advocacy. The team's knowledge of community perspectives, paired with Axon's deep understanding of technology and the needs of law enforcement, is resulting in initiatives that facilitate bridge-building between police and communities.
"Axon's Community Impact team was formed to incorporate community voice into Axon products and services and assist our public safety partners with programming and strategies to enhance their relationships with the communities they serve." — Regina Holloway, Axon's VP of Community Impac - Axon Aid supports Louisiana first responders following Hurricane Ida
- Axon Aid, our philanthropic arm, deployed multiple teams to the coastal parishes in Louisiana following Hurricane Ida. Axon dispatched 10 drone pilots to run more than 50 missions to support emergency management teams. These missions included mass damage assessments and levee inspections. The Axon Aid deployment for Hurricane Ida is the tenth since its founding in 2018. The volunteer-powered emergency relief program supports communities and first responders in responding to disasters. To learn more about Axon Aid, please visit: www.axon.com/aid
- Virtual Governance & ESG Roadshow:
- Axon's board of directors and management team have been connecting with shareholders on corporate governance and ESG matters. We are committed to being best-in-class in everything we do, and as we continue to grow, we have sought to identify corporate governance and ESG changes that will create value for our shareholders and advance our corporate values and strategic vision. We believe shareholder engagement is critically important. Shareholders who wish to provide feedback may email ir@axon.com.
- Learn more about Axon's ESG efforts:
- We encourage shareholders to read our 2021 ESG/CSR report, which covers a variety of topics including TASER device safety, how our products support UN Sustainable Development goals, information security and data privacy, information about our AI Ethics Board, employee wellness and diversity, and governance.
(4) | The financial terms were not material to Axon's balance sheet or expected results. |
Summary of Q3 2021 results:
- Revenue of $232 million grew 39% year over year, on top of 27% growth in Q3 2020, reflecting global demand for our growing software suite and TASER 7 devices. Domestic revenue and international revenue grew 34% and 70%, respectively, year over year.
- Gross margin of 62.3% improved 330 basis points year over year, reflecting favorable body camera mix, strong demand for our premium TASER offerings and the continued benefit of engineered lower build costs in our TASER segment.
- Operating expenses of $142 million included $34 million in stock-based compensation expense.
- SG&A of $99 million included $26 million in stock-based compensation expense.
- R&D of $42 million included $8 million in stock-based compensation expense.
- GAAP diluted EPS was $0.67 based on GAAP net income of $49 million. Non-GAAP EPS was $1.17.
- Of the $35 million in total stock-based compensation expense in Q3 2021, $25 million was related to our eXponential Stock Performance Plan (XSPP) and CEO Performance Award(5).
- In Q3 2021, $16 million was tied to acceleration of expected attainment dates, which means the time over which we record expense is shortened. Since Q1 2021, all 12 operational goals have been considered probable of attainment.
- Since the CEO Performance Award was adopted in 2018, we have expensed $220 million of total potential expense of $246 million under the plan. Since the XSPP plan was adopted in 2019, we have expensed $161 million of total potential expense of $196 million currently projected under the plan for XSPP grants issued to date. Since the CEO Performance Award was issued in 2018, total shareholder return was nearly 500% as of Friday, November 12, 2021.
- As a result of our strong Q3 performance, we expect one tranche of the XSPP awards to vest(6) in the coming weeks. Vesting of a second tranche for which the operational goal was achieved as of September 30, 2021, is contingent upon attainment of the related market capitalization goal.
- The effective tax rate was favorably impacted by a $(44.3) million discrete tax benefit from the vesting of stock-based compensation awards during the quarter.
- Quarterly Adjusted EBITDA grew 50% year over year to $51 million, representing a 21.8% margin on revenue and highlighting our ability to demonstrate leverage while also investing for scale.
- Cash and cash equivalents and investments totaled $548 million at September 30, 2021, down $156 million sequentially. Operating cash flow was $16 million. The change in cash and cash equivalents and investments included the use of $172 million in cash for tax withholdings arising from stock awards that were net settled during the quarter and $90 million for our investment in Cellebrite, partially offset by proceeds of $106 million from our at-the-market offering.
- Axon has no debt.
(5) | These innovative stock-based compensation plans were approved by shareholders in 2018 and 2019 and align the interests of management and employees with shareholders. |
(6) | Under the shareholder-approved XSPP, participants have a 2.5-year mandatory holding period on net vested shares. Under the shareholder-approved CEO Performance Award, the CEO has a 2.5-year holding period from option exercise. |
Financial commentary by segment:
TASER
THREE MONTHS ENDED | CHANGE | |||||||||||||||||
30 SEP 2021 | 30 JUN 2021 | 30 SEP 2020 | QoQ | YoY | ||||||||||||||
(in thousands) | ||||||||||||||||||
Net sales | $ | 121,491 | $ | 112,528 | $ | 84,406 | 8.0 | % | 43.9 | % | ||||||||
Gross margin | 65.8 | % | 66.4 | % | 62.9 | % | (60) | bp | 290 | bp | ||||||||
- TASER segment revenue of $121 million grew 44% year over year driven by strong demand globally for the TASER 7 platform.
- Gross margin of 65.8% was up 290 bps year over year tied to strong demand combined with the continued benefit of engineered lower build costs. Gross margins declined slightly on a sequential basis, primarily driven by product mix and higher freight costs.
Software & Sensors
THREE MONTHS ENDED | CHANGE | |||||||||||||||||
30 SEP 2021 | 30 JUN 2021 | 30 SEP 2020 | QoQ | YoY | ||||||||||||||
(in thousands) | ||||||||||||||||||
Axon Cloud net sales | $ | 63,264 | $ | 60,477 | $ | 45,462 | 4.6 | % | 39.2 | % | ||||||||
Axon Cloud gross margin | 74.6 | % | 74.5 | % | 77.1 | % | 10 | bp | (250) | bp | ||||||||
Sensors and Other net sales | $ | 47,234 | $ | 45,790 | $ | 36,574 | 3.2 | % | 29.1 | % | ||||||||
Sensors and Other gross margin | 36.9 | % | 39.7 | % | 27.5 | % | (280) | bp | 940 | bp | ||||||||
- Axon Cloud revenue grew 39% year over year to $63 million, reflecting strong domestic demand. On a sequential basis, Axon Cloud revenue increased $3 million and reflects a decrease of approximately $1 million in non-recurring service revenue, including professional services.
- Axon Cloud gross margin of 74.6% includes expected costs to scale our cloud business. This includes the low-to-no margin professional services costs of teams who help our customers deploy Axon's solutions. We expect these costs to continue to be reflected in gross margins as we scale our cloud business. The software-only revenue in this segment, which includes cloud storage and compute costs, has consistently carried a gross margin above 80%.
- Sensors & Other revenue grew 29% year over year to $47 million, reflecting strong body camera demand.
- Sensors & Other gross margin was 36.9%. As a reminder, we manage toward a 25% gross margin for camera and sensors hardware, and the gross margin will fluctuate quarter to quarter depending on the customer mix.
Forward-looking performance indicators:
30 SEP 2021 | 30 JUN 2021 | 31 MAR 2021 | 31 DEC 2020 | 30 SEP 2020 | ||||||||||||||||
($ in thousands) | ||||||||||||||||||||
Annual recurring revenue (1) | $ | 288,691 | $ | 260,178 | $ | 242,357 | $ | 221,263 | $ | 203,815 | ||||||||||
Net revenue retention (2) | 119 | % | 119 | % | 119 | % | 119 | % | 120 | % | ||||||||||
Total company future | $ | 2,390,000 | $ | 2,040,000 | $ | 1,790,000 | $ | 1,730,000 | $ | 1,510,000 | ||||||||||
Percentage of TASER | 58 | % | 55 | % | 64 | % | 53 | % | 75 | % | ||||||||||
(1) | Monthly recurring license, integration, warranty, and storage revenue annualized. |
(2) | Refer to "Statistical Definitions" below. |
- Annual Recurring Revenue (ARR) grew 42% year over year to $288.7 million. On a sequential basis, ARR increased by $29 million, slightly ahead of our expectation due to strong demand for added SaaS software features in all three strategic software growth categories: digital evidence management, productivity solutions and real-time operations, and strong contributions from the federal market and international regions.
- Net revenue retention was 119% in the quarter, reflecting our ability to deliver additional value to our customers over time and de minimis attrition. We drive adoption of our cloud software solutions through integrated bundling. We are seeing large customers upgrading their subscriptions at individual net dollar retention rates of 140% to 300% to take advantage of our growing suite of productivity and digital evidence management tools. Our law enforcement agency customers often sign up for five to ten-year subscriptions. This SaaS metric purposely excludes the hardware portion of customer subscriptions. We further define this metric under "Statistical Definitions."
- Total company future contracted revenue grew to $2.39 billion, reflecting strong bookings in the quarter. Most of our bookings are for multi-year contracts. See definition of this metric under "Statistical Definitions."
- The percentage of TASER devices sold on a subscription was 58% in the quarter. As a reminder, Axon has been successfully transitioning its TASER hardware business into a subscription service in more mature markets and expanding into new markets where some initial sales are not on a subscription, with the intention of building subscription businesses in those markets over time.
Outlook:
The following forward-looking statements reflect Axon's expectations as of November 15, 2021, and are subject to risks and uncertainties. As our investments have yielded results ahead of our expectations thus far in 2021, we intend to continue investing for growth.
Our updated 2021 outlook is as follows:
- We expect to achieve revenue at the high end of our previously communicated range of $840 million to $850 million. Full year revenue of $850 million represents 25% growth over 2020 and reflects our long-term strategy of scaling a business that supports a 20%-plus revenue CAGR.
- TASER 7 demand remains exceptionally strong and our backlog continues to grow. Our guidance reflects our expectation that approximately $30 million of previously anticipated Q4 2021 TASER segment revenue will shift into the first half of 2022 resulting from industry-wide chip shortages that impacted our TASER 7 platform.
- As a reminder, the year-ago quarter, Q4 2020, benefitted from a $20 million TASER 7 order from an international customer—the largest TASER order in our company's history.
- We are raising our expectations for Adjusted EBITDA to a range of $163 million to $168 million, from a range of $155 million to $160 million, previously.
- We provide Adjusted EBITDA guidance, rather than net income guidance, due to the inherent difficulty of forecasting certain types of expenses such as stock-based compensation and income tax expenses, which affect net income but not Adjusted EBITDA. We are unable to reasonably estimate the impact of such expenses, if any, on net income. Accordingly, we do not provide a reconciliation of projected net income to projected Adjusted EBITDA.
- We expect stock-based compensation expense to be more than $300 million for the full year. Because our stock-based compensation expense may fluctuate significantly based on changes in the probability of attaining certain operational or market capitalization metrics or attainment of such metrics and with changes in the expected or actual timing of such attainment, it is inherently difficult to forecast future stock-based compensation expense.
- Expectations for capital expenditures of approximately $65 million to $70 million in 2021 are unchanged. These include investments to support capacity expansion and automation on TASER device and cartridge manufacturing, and are discussed in greater detail in our Q4 2020 shareholder letter.
- As we execute upon a scaling global profile and delivering rapid 2021 growth, our strengthening view of the business in 2022 includes at least $1.0 billion in revenue. We are extremely proud of the high level of execution from our teams that has set us up for continued top-line strength, solid margin performance and scaling profitability.
Thank you for investing in our mission to protect life,
Rick Smith, CEO
Luke Larson, President
Jawad Ahsan, CFO
Quarterly conference call and webcast
We will host our Q3 2021 earnings conference call webinar on Monday, November 15 at 2 p.m. PT / 5 p.m. ET.
The webcast will be available via a link on Axon's investor relations website at https://investor.axon.com (https://investor.axon.com/), or can be accessed directly via https://axon.zoom.us/j/96766824541.
Statistical Definitions
Bookings: We consider bookings to be a statistical measure defined as the sales price of orders (not invoiced sales), including contractual optional periods we expect to be exercised, net of cancellations, inclusive of renewals, placed in the relevant fiscal period, regardless of when the products or services ultimately will be provided, so long as they are expected to occur within five years. Most bookings will be invoiced in subsequent periods. Due to municipal government funding rules, in some cases certain of the future period amounts included in bookings are subject to budget appropriation or other contract cancellation clauses. Although we have entered into contracts for the delivery of products and services in the future and anticipate the contracts will be fulfilled, if agencies do not exercise contractual options, do not appropriate funds in future year budgets, or enact a cancellation clause, revenue associated with these bookings may not ultimately be recognized, resulting in a future reduction to bookings. Bookings, as presented here, represent total company bookings inclusive of all products, and should not be confused with our historical reported measure of Software & Sensors bookings, which excluded TASER-related bookings. Certain customers sign contracts for time periods longer than five-years, which generates a larger-sized booking — but the expected exercise amounts after the five-year period is not included in bookings, as described here, in order to facilitate comparisons between periods.
Net revenue retention: Dollar-based net revenue retention is an important metric to measure our ability to retain and expand our relationships with existing customers. We calculate it as the software and camera warranty subscription and support revenue from a base set of agency customers from which we generated Axon Cloud subscription revenue in the last month of a quarter divided by the software and camera warranty subscription and support revenue from the year-ago month of that same customer base. This calculation includes high-margin warranty but purposely excludes the lower-margin hardware subscription contingent of the customer contracts, as it is meant to be a SaaS metric that we use to monitor the health of the recurring revenue business we are building. This calculation also excludes the implied monthly revenue contribution of customers that were added since the year-ago quarter, and therefore excludes the benefit of new customer acquisition. The metric includes customers, if any, that terminated during the annual period, and therefore, this metric is inclusive of customer churn. This metric is downwardly adjusted to account for the effect of phased deployments -- meaning that for the year-ago period, we consider the total contractually obligated implied monthly revenue amount, rather than monthly revenue amounts that might have been in actuality smaller on a GAAP basis due to the customer not having yet fully deployed their Axon solution. For more information relative to our revenue recognition policies, please reference our SEC filings.
Total company future contracted revenue: Total company future contracted revenue includes both recognized contract liabilities as well as amounts that will be invoiced and recognized in future periods. The remaining performance obligations are limited only to arrangements that meet the definition of a contract under Topic 606 as of September 30, 2021. We expect to recognize between15% - 20% of this balance over the next twelve months, and generally expect the remainder to be recognized over the following five to seven years, subject to risks related to delayed deployments, budget appropriation or other contract cancellation clauses.
Non-GAAP Measures
To supplement the Company's financial results presented in accordance with GAAP, we present the non-GAAP financial measures of EBITDA, Adjusted EBITDA, Non-GAAP Net Income, Non-GAAP Diluted Earnings Per Share and Free Cash Flow. The Company's management uses these non-GAAP financial measures in evaluating the Company's performance in comparison to prior periods. We believe that both management and investors benefit from referring to these non-GAAP financial measures in assessing its performance, and when planning and forecasting our future periods. A reconciliation of GAAP to the non-GAAP financial measures is presented herein.
- EBITDA (Most comparable GAAP Measure: Net income) - Earnings before interest expense, investment interest income, income taxes, depreciation and amortization.
- Adjusted EBITDA (Most comparable GAAP Measure: Net income) - Earnings before interest expense, investment interest income, income taxes, depreciation, amortization, non-cash stock-based compensation expense and pre-tax certain other items (listed below).
- Non-GAAP Net Income (Most comparable GAAP Measure: Net income) - Net income excluding the costs of non-cash stock-based compensation and excluding net gain/loss/write-down/disposal/abandonment of property, equipment and intangible assets; loss on impairment; costs related to business acquisitions and investments in unconsolidated affiliates; costs related to the FTC litigation and pre-tax certain other items (listed below). The Company tax-effects non-GAAP adjustments using the blended statutory federal and state tax rates for each period presented.
- Non-GAAP Diluted Earnings Per Share (Most comparable GAAP Measure: Earnings Per share) - Measure of Company's Non-GAAP Net Income divided by the weighted average number of diluted common shares outstanding during the period presented.
- Free Cash Flow (Most comparable GAAP Measure: Cash flow from operating activities) - cash flows provided by operating activities minus purchases of property and equipment and intangible assets.
Caution on Use of Non-GAAP Measures
Although these non-GAAP financial measures are not consistent with GAAP, management believes investors will benefit by referring to these non-GAAP financial measures when assessing the Company's operating results, as well as when forecasting and analyzing future periods. However, management recognizes that:
- these non-GAAP financial measures are limited in their usefulness and should be considered only as a supplement to the Company's GAAP financial measures;
- these non-GAAP financial measures should not be considered in isolation from, or as a substitute for, the Company's GAAP financial measures;
- these non-GAAP financial measures should not be considered to be superior to the Company's GAAP financial measures; and
- these non-GAAP financial measures were not prepared in accordance with GAAP or under a comprehensive set of rules or principles.
Further, these non-GAAP financial measures may be unique to the Company, as they may be different from similarly titled non-GAAP financial measures used by other companies. As such, this presentation of non-GAAP financial measures may not enhance the comparability of the Company's results to the results of other companies.
About Axon
Axon is the global leader in connected public safety technologies. We are a mission-driven company whose overarching goal is to protect life. Our vision is a world where bullets are obsolete, where social conflict is dramatically reduced, where everyone has access to a fair and effective justice system and where racial equity, diversity and inclusion is centered in all of our work. Axon is also a leading provider of body cameras for US public safety, providing more transparency and accountability to communities than ever before.
You may learn about our Environmental, Social, and Governance (ESG) and Corporate Social Responsibility (CSR) efforts by reading our ESG report at investor.axon.com.
We work hard for those who put themselves in harm's way for all of us. More than 258,000 lives and countless dollars have been saved with the Axon network of devices, apps and people. Learn more at www.axon.com or by calling (800) 978-2737. Axon is a global company with headquarters in Scottsdale, Arizona, and a global software engineering hub in Seattle, Washington, as well as additional offices in the US, Australia, Canada, Finland, Vietnam, the UK and the Netherlands.
Cellebrite is a trademark of Cellebrite Mobile Synchronization Ltd.; Cradlepoint is a trademark of Cradlepoint, Inc.; Facebook is a trademark of Facebook, Inc.; Skydio is a trademark of Skydio, Inc.; Twitter is a trademark of Twitter, Inc.; Verizon is a trademark of Verizon Trademark Services, LLC and Vievu is a trademark of Vievu, LLC. Axon, Axon Academy, Axon Aid, Axon Air, Axon Body, Axon Fleet, Axon Respond, Axon Voyager, TASER, TASER 7, Protect Life and the Delta Logo are trademarks of Axon Enterprise, Inc., some of which are registered in the US and other countries. For more information, visit www.axon.com/legal. All rights reserved.
Follow Axon here:
- Axon on Twitter: https://twitter.com/axon_us
- Axon on Facebook: https://www.facebook.com/Axon.ProtectLife/
Forward-looking statements
Forward-looking statements in this letter include, without limitation, statements regarding: the impact of the COVID-19 pandemic; proposed products and services and related development efforts and activities; expectations about the market for our current and future products and services; strategies and trends relating to subscription plan programs and revenues; strategies and trends, including the benefits of, research and development investments; the timing and realization of future contracted revenue; expectations about customer behavior; statements concerning projections, predictions, expectations, estimates or forecasts as to our business, financial and operational results and future economic performance, including our outlook for 2021 fourth quarter and full year revenue, Adjusted EBITDA, stock-based compensation expense, capital expenditures, and 2022 full year revenue; statements of management's strategies, goals and objectives and other similar expressions; as well as the ultimate resolution of financial statement items requiring critical accounting estimates, including those set forth in our Form 10–K for the year ended December 31, 2020. Such statements give our current expectations or forecasts of future events; they do not relate strictly to historical or current facts. Words such as "may," "will," "should," "could," "would," "predict," "potential," "continue," "expect," "anticipate," "future," "intend," "plan," "believe," "estimate," and similar expressions, as well as statements in future tense, identify forward-looking statements. However, not all forward-looking statements contain these identifying words.
We cannot guarantee that any forward-looking statement will be realized, although we believe we have been prudent in our plans and assumptions. Achievement of future results is subject to risks, uncertainties and potentially inaccurate assumptions. The following important factors could cause actual results to differ materially from those in the forward-looking statements: the potential global impacts of the COVID-19 pandemic; our exposure to cancellations of government contracts due to appropriation clauses, exercise of a cancellation clause, or non-exercise of contractually optional periods; our ability to design, introduce and sell new products or features; our ability to defend against litigation and protect our intellectual property, and the resulting costs of this activity; our ability to manage our supply chain and avoid production delays, shortages and impacts to expected gross margins; the impact of stock compensation expense, impairment expense, and income tax expense on our financial results; customer purchase behavior, including adoption of our software as a service delivery model; negative media publicity regarding our products; the impact of product mix on projected gross margins; defects in our products; changes in the costs of product components and labor; loss of customer data, a breach of security, or an extended outage, including by our third party cloud-based storage providers; exposure to international operational risks; delayed cash collections and possible credit losses due to our subscription model; changes in government regulations in the U.S. and in foreign markets, especially related to the classification of our products by the United States Bureau of Alcohol, Tobacco, Firearms and Explosives; our ability to integrate acquired businesses; our ability to attract and retain key personnel; and counter-party risks relating to cash balances held in excess of FDIC insurance limits. Many events beyond our control may determine whether results we anticipate will be achieved. Should known or unknown risks or uncertainties materialize, or should underlying assumptions prove inaccurate, actual results could differ materially from past results and those anticipated, estimated or projected. You should bear this in mind as you consider forward-looking statements. Our Annual Report on Form 10-K and our Quarterly Reports on Form 10-Q list various important factors that could cause actual results to differ materially from expected and historical results. These factors are intended as cautionary statements for investors within the meaning of Section 21E of the Exchange Act and Section 27A of the Securities Act. Readers can find them under the heading "Risk Factors" in the Annual Report on Form 10-K and in the Quarterly Reports on Form 10-Q, and investors should refer to them. You should understand that it is not possible to predict or identify all such factors. Consequently, you should not consider any such list to be a complete set of all potential risks or uncertainties.
Except as required by law, we undertake no obligation to publicly update forward-looking statements, whether as a result of new information, future events or otherwise. You are advised, however, to consult any further disclosures we make on related subjects in our Form 10-Q, 8-K and 10-K reports to the SEC.
Update on Legal Matters:
Axon v. FTC
Axon continues to vigorously prosecute its Federal court constitutional case against the FTC while the FTC's separate antitrust administrative action against the company remains stayed.
As background, Axon's Federal court constitutional challenge against the FTC was dismissed in April 2020, without prejudice, for lack of jurisdiction, holding that Axon must first bring its claims through the FTC's administrative process. Axon appealed that ruling to the Ninth Circuit (No. 20-15662). In January 2021, a Ninth Circuit panel in a 2-1 split decision affirmed the district court ruling against Axon on the jurisdictional question. The Court then denied Axon's petition for en banc rehearing but granted Axon's motion to stay the appellate mandate pending resolution of the company's certiorari petition with the U.S. Supreme Court.
Axon's Supreme Court petition (No. 21-86 docketed July 22, 2021) presents two questions:
1. Whether Congress impliedly stripped federal district courts of jurisdiction over constitutional challenges to the Federal Trade Commission's structure, procedures, and existence by granting the courts of appeals jurisdiction to "affirm, enforce, modify, or set aside" the Commission's cease-and-desist orders.
2. Whether, on the merits, the structure of the Federal Trade Commission, including the dual-layer for-cause removal protections afforded its administrative law judges, is consistent with the Constitution.
Links to all Court filings and opinions can be found on Axon's FTC Investor Briefing page at https://www.axon.com/ftc.
As a reminder, in parallel to these matters Axon is evaluating strategic alternatives to litigation, which Axon might pursue if determined to be in the best interests of shareholders and customers. This could include a divestiture of the Vievu entity and/or related assets. While Axon continues to believe the 2018 acquisition of Vievu was lawful and a benefit to Vievu's customers, the cost, risk and distraction of protracted litigation merit consideration of settlement if achievable on terms agreeable to the FTC and Axon.
For investor relations information please contact Investor Relations via email at IR@axon.com.
CONTACT:
Investor Relations
Axon Enterprise, Inc.
IR@axon.com
AXON ENTERPRISE, INC. | |||||||||||||||
CONSOLIDATED STATEMENTS OF OPERATIONS | |||||||||||||||
(Unaudited) | |||||||||||||||
(in thousands, except per share data) | |||||||||||||||
THREE MONTHS ENDED | NINE MONTHS ENDED | ||||||||||||||
30 SEP 2021 | 30 JUN 2021 | 30 SEP 2020 | 30 SEP 2021 | 30 SEP 2020 | |||||||||||
Net sales from products | $ | 165,803 | $ | 156,427 | $ | 120,091 | $ | 463,116 | $ | 326,134 | |||||
Net sales from services | 66,186 | 62,368 | 46,351 | 182,687 | 128,729 | ||||||||||
Net sales | 231,989 | 218,795 | 166,442 | 645,803 | 454,863 | ||||||||||
Cost of product sales | 71,336 | 65,301 | 57,798 | 195,253 | 150,507 | ||||||||||
Cost of service sales | 16,086 | 15,565 | 10,404 | 44,701 | 29,331 | ||||||||||
Cost of sales | 87,422 | 80,866 | 68,202 | 239,954 | 179,838 | ||||||||||
Gross margin | 144,567 | 137,929 | 98,240 | 405,849 | 275,025 | ||||||||||
Operating expenses: | |||||||||||||||
Sales, general and administrative | 99,295 | 177,662 | 74,443 | 403,554 | 209,763 | ||||||||||
Research and development | 42,382 | 53,952 | 29,246 | 143,352 | 85,187 | ||||||||||
Total operating expenses | 141,677 | 231,614 | 103,689 | 546,906 | 294,950 | ||||||||||
Income (loss) from operations | 2,890 | (93,685) | (5,449) | (141,057) | (19,925) | ||||||||||
Interest and other income, net | (5,530) | 41,841 | 2,040 | 36,896 | 4,594 | ||||||||||
Income before provision for income taxes | (2,640) | (51,844) | (3,409) | (104,161) | (15,331) | ||||||||||
Provision for (benefit from) income taxes | (51,164) | (4,727) | (2,536) | (57,651) | 12,227 | ||||||||||
Net income (loss) per common and common | $ | 48,524 | $ | (47,117) | $ | (873) | $ | (46,510) | $ | (27,558) | |||||
Net income (loss) per common and common | |||||||||||||||
Basic | $ | 0.73 | $ | (0.72) | $ | (0.01) | $ | (0.71) | $ | (0.45) | |||||
Diluted | $ | 0.67 | $ | (0.72) | $ | (0.01) | $ | (0.71) | $ | (0.45) | |||||
Weighted average number of common and common | |||||||||||||||
Basic | 66,192 | 65,166 | 63,496 | 65,139 | 61,159 | ||||||||||
Diluted | 72,441 | 65,166 | 63,496 | 65,139 | 61,159 | ||||||||||
AXON ENTERPRISE, INC. | ||||||||||||||||||||||||||||||||||||
SEGMENT REPORTING | ||||||||||||||||||||||||||||||||||||
(Unaudited) | ||||||||||||||||||||||||||||||||||||
(dollars in thousands) | ||||||||||||||||||||||||||||||||||||
THREE MONTHS ENDED | THREE MONTHS ENDED | THREE MONTHS ENDED | ||||||||||||||||||||||||||||||||||
30 SEP 2021 | 30 JUN 2021 | 30 SEP 2020 | ||||||||||||||||||||||||||||||||||
Software | Software | Software | ||||||||||||||||||||||||||||||||||
and | and | and | ||||||||||||||||||||||||||||||||||
TASER | Sensors | Total | TASER | Sensors | Total | TASER | Sensors | Total | ||||||||||||||||||||||||||||
Net sales from products (1) | $ | 118,569 | $ | 47,234 | $ | 165,803 | $ | 110,637 | $ | 45,790 | $ | 156,427 | $ | 83,517 | $ | 36,574 | $ | 120,091 | ||||||||||||||||||
Net sales from services (2) | 2,922 | 63,264 | 66,186 | 1,891 | 60,477 | 62,368 | 889 | 45,462 | 46,351 | |||||||||||||||||||||||||||
Net sales | 121,491 | 110,498 | 231,989 | 112,528 | 106,267 | 218,795 | 84,406 | 82,036 | 166,442 | |||||||||||||||||||||||||||
Cost of product sales | 41,554 | 29,782 | 71,336 | 37,701 | 27,600 | 65,301 | 31,297 | 26,501 | 57,798 | |||||||||||||||||||||||||||
Cost of service sales | — | 16,086 | 16,086 | 145 | 15,420 | 15,565 | — | 10,404 | 10,404 | |||||||||||||||||||||||||||
Cost of sales | 41,554 | 45,868 | 87,422 | 37,846 | 43,020 | 80,866 | 31,297 | 36,905 | 68,202 | |||||||||||||||||||||||||||
Gross margin | 79,937 | 64,630 | 144,567 | 74,682 | 63,247 | 137,929 | 53,109 | 45,131 | 98,240 | |||||||||||||||||||||||||||
Gross margin % | 65.8 | % | 58.5 | % | 62.3 | % | 66.4 | % | 59.5 | % | 63.0 | % | 62.9 | % | 55.0 | % | 59.0 | % | ||||||||||||||||||
Research and development | 10,476 | 31,906 | 42,382 | 12,313 | 41,639 | 53,952 | 3,355 | 25,891 | 29,246 | |||||||||||||||||||||||||||
NINE MONTHS ENDED | NINE MONTHS ENDED | |||||||||||||||||||||||
30 SEP 2021 | 30 SEP 2020 | |||||||||||||||||||||||
Software | Software | |||||||||||||||||||||||
and | and | |||||||||||||||||||||||
TASER | Sensors | Total | TASER | Sensors | Total | |||||||||||||||||||
Net sales from products (1) | $ | 326,508 | $ | 136,608 | $ | 463,116 | $ | 228,569 | $ | 97,565 | $ | 326,134 | ||||||||||||
Net sales from services (2) | 6,510 | 176,177 | 182,687 | 2,222 | 126,507 | 128,729 | ||||||||||||||||||
Net sales | 333,018 | 312,785 | 645,803 | 230,791 | 224,072 | 454,863 | ||||||||||||||||||
Cost of product sales | 112,200 | 83,053 | 195,253 | 88,787 | 61,720 | 150,507 | ||||||||||||||||||
Cost of service sales | 145 | 44,556 | 44,701 | — | 29,331 | 29,331 | ||||||||||||||||||
Cost of sales | 112,345 | 127,609 | 239,954 | 88,787 | 91,051 | 179,838 | ||||||||||||||||||
Gross margin | 220,673 | 185,176 | 405,849 | 142,004 | 133,021 | 275,025 | ||||||||||||||||||
Gross margin % | 66.3 | % | 59.2 | % | 62.8 | % | 61.5 | % | 59.4 | % | 60.5 | % | ||||||||||||
Research and development | 32,032 | 111,320 | 143,352 | 10,149 | 75,038 | 85,187 | ||||||||||||||||||
(1) | Software and Sensors "products" revenue consists of sensors, including on-officer body cameras, Axon Fleet cameras, other hardware sensors, warranties on sensors, and other products, and is sometimes referred to as Sensors and Other revenue. |
(2) | Software and Sensors "services" revenue comprises sales related to the Axon Cloud, which includes Axon Evidence, cloud-based evidence management software revenue, other recurring cloud-hosted software revenue and related professional services, and is sometimes referred to as Axon Cloud revenue. |
AXON ENTERPRISE, INC. | ||||||||||||||||||
UNIT SALES STATISTICS | ||||||||||||||||||
(Unaudited) | ||||||||||||||||||
Units in whole numbers | ||||||||||||||||||
THREE MONTHS ENDED | NINE MONTHS ENDED | |||||||||||||||||
30 SEP | 30 SEP | Unit | Percent | 30 SEP | 30 SEP | Unit | Percent | |||||||||||
2021 | 2020 | Change | Change | 2021 | 2020 | Change | Change | |||||||||||
TASER 7 | 36,350 | 15,908 | 20,442 | 128.5 | % | 77,421 | 36,352 | 41,069 | 113.0 | % | ||||||||
TASER X26P | 6,596 | 8,119 | (1,523) | (18.8) | 21,837 | 26,780 | (4,943) | (18.5) | ||||||||||
TASER X2 | 5,562 | 10,078 | (4,516) | (44.8) | 24,188 | 33,656 | (9,468) | (28.1) | ||||||||||
TASER Pulse | 3,232 | 12,811 | (9,579) | (74.8) | 18,225 | 21,501 | (3,276) | (15.2) | ||||||||||
Cartridges | 1,327,971 | 852,980 | 474,991 | 55.7 | 3,751,060 | 2,441,612 | 1,309,448 | 53.6 | ||||||||||
Axon Body | 58,248 | 62,873 | (4,625) | (7.4) | 149,914 | 137,803 | 12,111 | 8.8 | ||||||||||
Axon Flex | 3,390 | 3,175 | 215 | 6.8 | 6,801 | 8,213 | (1,412) | (17.2) | ||||||||||
Axon Fleet | 2,753 | 2,396 | 357 | 14.9 | 6,655 | 7,399 | (744) | (10.1) | ||||||||||
Axon Dock | 8,556 | 9,165 | (609) | (6.6) | 20,625 | 19,096 | 1,529 | 8.0 | ||||||||||
AXON ENTERPRISE, INC. | ||||||||||||||||
RECONCILIATION OF GAAP TO NON-GAAP FINANCIAL MEASURES | ||||||||||||||||
(Unaudited) | ||||||||||||||||
Dollars in thousands | ||||||||||||||||
THREE MONTHS ENDED | NINE MONTHS ENDED | |||||||||||||||
30 SEP 2021 | 30 JUN 2021 | 30 SEP 2020 | 30 SEP 2021 | 30 SEP 2020 | ||||||||||||
EBITDA and Adjusted EBITDA: | ||||||||||||||||
Net income (loss) | $ | 48,524 | $ | (47,117) | $ | (873) | $ | (46,510) | $ | (27,558) | ||||||
Depreciation and amortization | 4,838 | 4,291 | 3,133 | 13,420 | 8,944 | |||||||||||
Interest expense | 5 | 17 | 32 | 27 | 44 | |||||||||||
Investment interest income | (123) | (502) | (965) | (1,158) | (3,157) | |||||||||||
Provision for (benefit from) income taxes | (51,164) | (4,727) | (2,536) | (57,651) | 12,227 | |||||||||||
EBITDA | $ | 2,080 | $ | (48,038) | $ | (1,209) | $ | (91,872) | $ | (9,500) | ||||||
Adjustments: | ||||||||||||||||
Stock-based compensation expense | $ | 35,062 | $ | 137,549 | $ | 26,094 | $ | 262,221 | $ | 80,124 | ||||||
Realized and unrealized (gains) losses on | 6,660 | (40,855) | — | (34,195) | — | |||||||||||
Transaction costs related to strategic | 393 | 110 | — | 888 | 923 | |||||||||||
Loss on disposal and abandonment of | — | 119 | 139 | 130 | 252 | |||||||||||
Loss (gain) on disposal and impairment of | 31 | (2) | 124 | 74 | 1,429 | |||||||||||
Costs related to FTC litigation | 242 | 147 | 8,573 | 622 | 18,542 | |||||||||||
Payroll taxes related to XSPP vesting | 6,069 | 2,217 | — | 9,738 | — | |||||||||||
Adjusted EBITDA | $ | 50,537 | $ | 51,247 | $ | 33,721 | $ | 147,606 | $ | 91,770 | ||||||
Net income (loss) as a percentage of net | 20.9 | % | (21.5) | % | (0.5) | % | (7.2) | % | (6.1) | % | ||||||
Adjusted EBITDA as a percentage of net | 21.8 | % | 23.4 | % | 20.3 | % | 22.9 | % | 20.2 | % | ||||||
Stock-based compensation expense: | ||||||||||||||||
Cost of product and service sales | $ | 1,112 | $ | 1,838 | $ | 744 | $ | 4,439 | $ | 2,170 | ||||||
Sales, general and administrative | 25,969 | 114,089 | 19,117 | 211,073 | 60,853 | |||||||||||
Research and development | 7,981 | 21,622 | 6,233 | 46,709 | 17,101 | |||||||||||
Total | $ | 35,062 | $ | 137,549 | $ | 26,094 | $ | 262,221 | $ | 80,124 | ||||||
(1) | Includes an unrealized loss of $6.7 million for the three months ended September 30, 2021, and net unrealized gains of $21.9 million and realized gain of $12.3 million for the nine months ended September 30, 2021. |
AXON ENTERPRISE, INC. | |||||||||||||||
RECONCILIATION OF GAAP TO NON-GAAP FINANCIAL MEASURES - continued | |||||||||||||||
(Unaudited) | |||||||||||||||
Dollars in thousands, except per share amounts | |||||||||||||||
THREE MONTHS ENDED | NINE MONTHS ENDED | ||||||||||||||
30 SEP 2021 | 30 JUN 2021 | 30 SEP 2020 | 30 SEP 2021 | 30 SEP 2020 | |||||||||||
Non-GAAP net income: | |||||||||||||||
GAAP net income (loss) | $ | 48,524 | $ | (47,117) | $ | (873) | $ | (46,510) | $ | (27,558) | |||||
Non-GAAP adjustments: | |||||||||||||||
Stock-based compensation expense | 35,062 | 137,549 | 26,094 | 262,221 | 80,124 | ||||||||||
Realized and unrealized (gains) losses on strategic investments and marketable securities (1) | 6,660 | (40,855) | — | (34,195) | — | ||||||||||
Loss on disposal and abandonment of intangible assets | — | 119 | 139 | 130 | 252 | ||||||||||
Loss (gain) on disposal and impairment of property and equipment, net | 31 | (2) | 124 | 74 | 1,429 | ||||||||||
Transaction costs related to strategic investments | 393 | 110 | — | 888 | 923 | ||||||||||
Costs related to FTC litigation | 242 | 147 | 8,573 | 622 | 18,542 | ||||||||||
Payroll taxes related to XSPP vesting | 6,069 | 2,217 | — | 9,738 | — | ||||||||||
Income tax effects | (12,064) | (24,826) | (8,618) | (59,671) | (24,984) | ||||||||||
Non-GAAP net income | $ | 84,917 | $ | 27,342 | $ | 25,439 | $ | 133,297 | $ | 48,728 | |||||
Diluted income (loss) per common share | |||||||||||||||
GAAP | $ | 0.67 | $ | (0.72) | $ | (0.01) | $ | (0.71) | $ | (0.45) | |||||
Non-GAAP | $ | 1.17 | $ | 0.38 | $ | 0.40 | $ | 1.89 | $ | 0.79 | |||||
Diluted weighted average shares outstanding | |||||||||||||||
GAAP | 72,441 | 65,166 | 63,496 | 65,139 | 61,159 | ||||||||||
Non-GAAP (2) | 72,441 | 71,689 | 64,087 | 70,515 | 61,818 | ||||||||||
(1) | Includes an unrealized loss of $6.7 million for the three months ended September 30, 2021, and net unrealized gains of $21.9 million and realized gain of $12.3 million for the nine months ended September 30, 2021. |
(2) | Non-GAAP diluted income per common share factors in higher diluted weighted average shares outstanding in periods where there is both a GAAP net loss and non-GAAP net income. |
AXON ENTERPRISE, INC. | ||||||
CONSOLIDATED BALANCE SHEETS | ||||||
(in thousands) | ||||||
30 SEP 2021 | 31 DEC 2020 | |||||
(Unaudited) | ||||||
ASSETS | ||||||
Current Assets: | ||||||
Cash and cash equivalents | $ | 281,691 | $ | 155,440 | ||
Short-term investments | 216,557 | 406,525 | ||||
Marketable securities | 83,340 | — | ||||
Accounts and notes receivable, net | 265,267 | 229,201 | ||||
Contract assets, net | 130,976 | 63,945 | ||||
Inventory, net | 93,279 | 89,958 | ||||
Prepaid expenses and other current assets | 52,710 | 36,883 | ||||
Total current assets | 1,123,820 | 981,952 | ||||
Property and equipment, net | 128,808 | 105,494 | ||||
Deferred tax assets, net | 104,169 | 45,770 | ||||
Intangible assets, net | 7,426 | 9,448 | ||||
Goodwill | 25,571 | 25,205 | ||||
Long-term investments | 49,431 | 90,681 | ||||
Long-term notes receivable, net | 12,621 | 22,457 | ||||
Long-term contract assets, net | 43,394 | 20,099 | ||||
Strategic investments | 58,520 | 11,711 | ||||
Other assets | 91,627 | 68,206 | ||||
Total assets | $ | 1,645,387 | $ | 1,381,023 | ||
LIABILITIES AND STOCKHOLDERS' EQUITY | ||||||
Current Liabilities: | ||||||
Accounts payable | 27,418 | 24,142 | ||||
Accrued liabilities | 88,894 | 59,843 | ||||
Current portion of deferred revenue | 250,651 | 163,959 | ||||
Customer deposits | 6,118 | 2,956 | ||||
Other current liabilities | 6,809 | 5,431 | ||||
Total current liabilities | 379,890 | 256,331 | ||||
Deferred revenue, net of current portion | 111,892 | 111,222 | ||||
Liability for unrecognized tax benefits | 4,580 | 4,503 | ||||
Long-term deferred compensation | 5,125 | 4,732 | ||||
Deferred tax liability | 155 | 649 | ||||
Other long-term liabilities | 29,842 | 27,331 | ||||
Total liabilities | 531,484 | 404,768 | ||||
Stockholders' Equity: | ||||||
Preferred stock | — | — | ||||
Common stock | 1 | 1 | ||||
Additional paid-in capital | 1,147,478 | 962,159 | ||||
Treasury stock | (155,947) | (155,947) | ||||
Retained earnings | 123,391 | 169,901 | ||||
Accumulated other comprehensive income (loss) | (1,020) | 141 | ||||
Total stockholders' equity | 1,113,903 | 976,255 | ||||
Total liabilities and stockholders' equity | $ | 1,645,387 | $ | 1,381,023 | ||
AXON ENTERPRISE, INC. | ||||||||||||||||
UNAUDITED CONDENSED CONSOLIDATED STATEMENTS OF CASH FLOWS | ||||||||||||||||
(in thousands) | ||||||||||||||||
THREE MONTHS ENDED | NINE MONTHS ENDED | |||||||||||||||
30 SEP 2021 | 30 JUN 2021 | 30 SEP 2020 | 30 SEP 2021 | 30 SEP 2020 | ||||||||||||
Cash flows from operating activities: | ||||||||||||||||
Net income (loss) | $ | 48,524 | $ | (47,117) | $ | (873) | $ | (46,510) | $ | (27,558) | ||||||
Adjustments to reconcile net income to net cash provided by | ||||||||||||||||
Depreciation and amortization | 4,838 | 4,291 | 3,133 | 13,420 | 8,944 | |||||||||||
Loss on disposal and abandonment of intangible assets | — | 119 | 139 | 130 | 252 | |||||||||||
Loss (gain) on disposal and impairment of property and | 31 | (2) | 124 | 74 | 1,429 | |||||||||||
Net loss (gain) on strategic investments and marketable securities | 6,660 | (40,855) | — | (34,195) | — | |||||||||||
Stock-based compensation | 35,062 | 137,549 | 26,094 | 262,221 | 80,124 | |||||||||||
Deferred income taxes | (52,004) | (6,291) | (5,518) | (58,893) | (11,670) | |||||||||||
Unrecognized tax benefits | 30 | (147) | (39) | 77 | 573 | |||||||||||
Bond premium amortization | 1,496 | 1,606 | 1,160 | 4,606 | 1,830 | |||||||||||
Noncash lease expense | 1,437 | 1,539 | 817 | 4,087 | 2,743 | |||||||||||
Provision for expected credit losses | 553 | 397 | 118 | 615 | 776 | |||||||||||
Change in assets and liabilities: | ||||||||||||||||
Accounts and notes receivable and contract assets | (114,106) | (35,286) | (39,176) | (118,094) | (48,551) | |||||||||||
Inventory | (1,306) | (2,368) | (16,100) | (3,154) | (59,371) | |||||||||||
Prepaid expenses and other assets | (15,586) | (6,368) | 3,729 | (28,906) | (4,822) | |||||||||||
Accounts payable, accrued liabilities and other liabilities | 38,909 | 7,681 | 8,657 | 28,528 | 25,365 | |||||||||||
Deferred revenue | 61,911 | 19,428 | 28,875 | 87,558 | 34,099 | |||||||||||
Net cash provided by operating activities | 16,449 | 34,176 | 11,140 | 111,564 | 4,163 | |||||||||||
Cash flows from investing activities: | ||||||||||||||||
Purchases of investments | (124,191) | (82,463) | (224,090) | (362,479) | (516,687) | |||||||||||
Proceeds from call / maturity of investments | 204,358 | 162,560 | 128,529 | 499,172 | 287,199 | |||||||||||
Proceeds from sale of strategic investments | — | 14,546 | 14,546 | — | ||||||||||||
Purchases of property and equipment | (12,470) | (13,510) | (58,472) | (36,501) | (66,023) | |||||||||||
Purchases of intangible assets | (14) | (102) | (66) | (157) | (177) | |||||||||||
Proceeds of disposal from property and equipment | (17) | 38 | 16 | 31 | 94 | |||||||||||
Strategic investments | — | (500) | — | (20,500) | (4,700) | |||||||||||
Business acquisition, net of cash acquired | (700) | — | — | (700) | — | |||||||||||
Net cash provided by (used in) investing activities | 66,966 | 80,569 | (154,083) | 93,412 | (300,294) | |||||||||||
Cash flows from financing activities: | ||||||||||||||||
Net proceeds from equity offering | 105,615 | — | — | 105,615 | 306,779 | |||||||||||
Proceeds from options exercised | — | — | — | — | 295 | |||||||||||
Income and payroll tax payments for net-settled stock awards | (172,205) | (3,267) | (1,119) | (182,517) | (6,886) | |||||||||||
Net cash provided by (used in) financing activities | (66,590) | (3,267) | (1,119) | (76,902) | 300,188 | |||||||||||
Effect of exchange rate changes on cash and cash equivalents | (1,508) | 73 | 812 | (1,827) | (303) | |||||||||||
Net increase (decrease) in cash and cash equivalents and restricted cash | 15,317 | 111,551 | (143,250) | 126,247 | 3,754 | |||||||||||
Cash and cash equivalents, beginning of period | 266,481 | 154,930 | 319,359 | 155,551 | 172,355 | |||||||||||
Cash and cash equivalents, end of period | $ | 281,798 | $ | 266,481 | $ | 176,109 | $ | 281,798 | $ | 176,109 | ||||||
AXON ENTERPRISE, INC. | |||||||||||||||
SELECTED CASH FLOW INFORMATION | |||||||||||||||
(Unaudited) | |||||||||||||||
(in thousands) | |||||||||||||||
THREE MONTHS ENDED | NINE MONTHS ENDED | ||||||||||||||
30 SEP 2021 | 30 JUN 2021 | 30 SEP 2020 | 30 SEP 2021 | 30 SEP 2020 | |||||||||||
Net cash provided by operating activities | $ | 16,449 | $ | 34,176 | $ | 11,140 | $ | 111,564 | $ | 4,163 | |||||
Purchases of property and equipment | (12,470) | (13,510) | (58,472) | (36,501) | (66,023) | ||||||||||
Purchases of intangible assets | (14) | (102) | (66) | (157) | (177) | ||||||||||
Free cash flow, a non-GAAP measure | $ | 3,965 | $ | 20,564 | $ | (47,398) | $ | 74,906 | $ | (62,037) | |||||
AXON ENTERPRISE, INC. | ||||||
SUPPLEMENTAL TABLES | ||||||
(in thousands) | ||||||
30 SEP 2021 | 31 DEC 2020 | |||||
(Unaudited) | ||||||
Cash and cash equivalents | $ | 281,691 | $ | 155,440 | ||
Short-term investments | 216,557 | 406,525 | ||||
Long-term investments | 49,431 | 90,681 | ||||
Total cash and cash equivalents and investments, net | $ | 547,679 | $ | 652,646 | ||
![]()
SOURCE Axon
